Foundation v14 for Amibroker (AFL)
niladri about 6 years ago Amibroker (AFL)
Foundation AFL for Amibroker v14
Modifications:
Included T3_include.afl in the main AFL & dropped it’s requiremnt from the original.
Dropped Yahoo fundamentals data section.
Dropped industry segment from original v13 code.
Fixed the syntax errors reported in new Amibroker version.
Instructions: ( tested Ok with Amibroker 6.2 )
1) Get this modified AFL Code from this page.
2) Download & extract jurikLib.dll and kpami.dll from the plugin bundle attached to this formula
3) Copy JurikLib.dll and kpami.dll and paste it in your Amibroker Plugin folder which is by default C:\Program Files\AmiBroker\Plugins
4) Now to view the charts Open Amibroker and goto File→New→New Chart
5) Then goto View→Charts and select the afl from the left plane under the Custom folder
6) To set the background of your choice, goto Tools→Preference and select the color tab and set the background color.
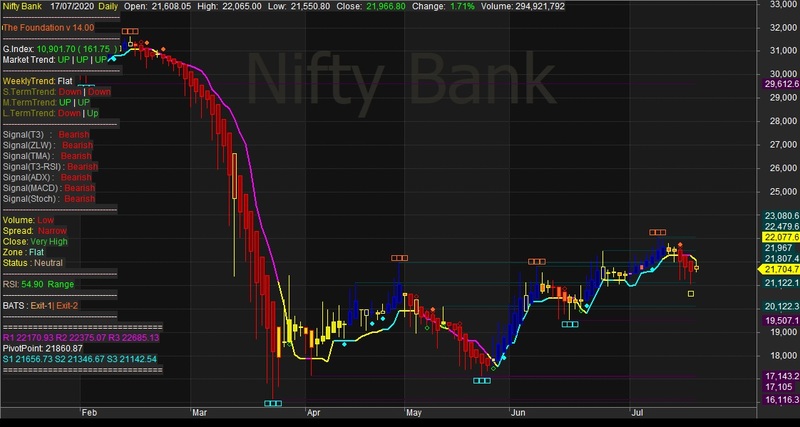
Screenshots
Files
Indicator / Formula
This is a complete AFL on its own. Just rightclick AFL code under charts & use Insert Linked.
// The Foundation by Southwind v-14.00 Int
// by southwind09@gmail.com

_SECTION_BEGIN("Chart Setting");
SetChartOptions(0,chartShowArrows|chartShowDates);
SetBarsRequired(sbrAll,sbrAll);
SetChartBkColor(ParamColor("Outer panel",colorDarkGrey));
_SECTION_END();

_SECTION_BEGIN("Haiken");

Show_color = ParamToggle("Display CandleColor", "No|Yes", 1);
r1 = Param( "ColorFast avg", 5, 2, 200, 1 );
r2 = Param( "ColorSlow avg", 10, 2, 200, 1 );
r3 = Param( "ColorSignal avg", 5, 2, 200, 1 );

Prd1=Param("ATR Period",4,1,20,1);
Prd2=Param("Look Back",7,1,20,1);
green = HHV(LLV(L,Prd1)+ATR(Prd1),Prd2);
red = LLV(HHV(H,Prd1)-ATR(Prd1),Prd2);

HaClose =EMA((O+H+L+C)/4,3);  // Woodie
HaOpen = AMA( Ref( HaClose, -1 ), 0.5 );
HaHigh = Max( H, Max( HaClose, HaOpen ) );
HaLow = Min( L, Min( HaClose, HaOpen ) );
Temp = Max(High, HaOpen);
Temp = Min(Low,HaOpen);

m1=MACD(r1,r2);

s1=Signal(r1,r2,r3);

mycolor=IIf(m1<0 AND m1>s1, ColorRGB(230,230,0),IIf(m1>0 AND m1>s1,ColorRGB(0,0,100),IIf(m1>0 AND m1<s1,colorOrange,colorDarkRed)));

if(Show_color)
{
	ColorHighliter = myColor;
	SetBarFillColor( ColorHighliter );
}

barColor=IIf(C>Green ,colorBlue,IIf(C < RED,colorRed,colorYellow));
barColor2=IIf(Close > Open, colorWhite, colorRed);


if( ParamToggle("Plot Normal Candle", "No,Yes", 1 ) )
	PlotOHLC( HaOpen, HaHigh, HaLow, HaClose, " " , barcolor, styleCandle | styleThick );
else
	PlotOHLC( Open, High, Low, Close, " " , barcolor2, styleCandle | styleThick );

_SECTION_END();

_SECTION_BEGIN("Line");
a = Param("Average Pds", 5, 1, 10, 1 );
n = Param("Short Pds", 8, 5, 21, 1 );
m = Param("Long Pds", 60, 0, 90, 1 );

Var4 =(Low+High+2*Close)/4;
OP = EMA(Var4,a);
res1 = HHV(OP,n);

res2 =HHV(OP,m);
sup2 =LLV(OP,m);
sup1 =LLV(OP,n);

Linecolor = IIf(Op==sup1,colorCustom12,IIf(Op==res1,10,7));

_SECTION_END();

_SECTION_BEGIN("Rays1");

line=ParamToggle("Line","No|Yes",1);

if(line)
{
	Pp1=Param("Ray_Period1",3,1,20,1);
	Pp2=Param("ATR_Period1",4,1,20,1);
	Cal=HHV(LLV(HaHigh,Pp1)-ATR(Pp2),5);

	Plot(Cal,"",Linecolor ,ParamStyle("styleLine 1",styleLine|styleThick,maskAll));

	positive= Cross(HaClose,Cal);
	negative=Cross(Cal,HaClose);

	PlotShapes( IIf( positive, shapeHollowSmallCircle, shapeNone ), colorBrightGreen, layer = 0, yposition = HaLow, offset = -4);
	PlotShapes( IIf( negative, shapeHollowSmallCircle, shapeNone ), colorRed, layer = 0, yposition = HaHigh, offset = 4);
}

_SECTION_END();


_SECTION_BEGIN("OsSetting");

Ovos = ParamToggle("Display_OVOS", "No|Yes", 0);
OBSetting=Param("Setting",40,1,500,1);

Bline = StochD(OBSetting);

Oversold=Bline<=30;
Overbought=Bline>=85;

if(Ovos)
{
	PlotShapes (IIf(Oversold, shapeHollowSmallCircle, shapeNone) ,38, layer = 0, yposition = haLow, offset = -8 );
	PlotShapes (IIf(Overbought, shapeHollowSmallCircle, shapeNone) ,colorBrown, layer = 0, yposition = haHigh, offset = 7 );
}

_SECTION_END();


_SECTION_BEGIN("TSKPPIVOT");  // Uses Plug-in dll's

CHiPr = 0;
CLoPr = 9999999;
blsLong = 0;
PrevCOBar = 0;
NumBars = 0;
PrePP = 0;
PrevLowVal = 9999999;
BuySig = 0;
blsShort = 0;
PrevHiVal = 0;
blsNewCO = 0;
BarDif   = 0;

KPA900Val = E_TSKPA900(Close);
KPAutoStopVal = E_TSKPAUTOSTOP(High,Low,Close);

// -- Create 0-initialized arrays the size of barcount
aHPivs = haHigh - haHigh;
aLPivs = haLow - haLow;
aHiVal = haHigh - haHigh;
aLoVal = haLow - haLow;


Ctmpl = E_TSKPCOLORTMPL(Open,High,Low,Close,Volume);
sctotal = 0;
sctotal = sctotal  + IIf(tskp_colortmplcnd0 > 0, 1, -1);
sctotal = sctotal  + IIf(tskp_colortmplcnd1 > 0, 1, -1);
sctotal = sctotal  + IIf(tskp_colortmplcnd2 > 0, 1, -1);
sctotal = sctotal  + IIf(tskp_colortmplcnd3 > 0, 1, -1);
sctotal = sctotal  + IIf(tskp_colortmplcnd4 > 0, 1, -1);
sctotal = sctotal  + IIf(tskp_colortmplcnd5 > 0, 1, -1);
sctotal = sctotal  + IIf(tskp_colortmplcnd6 > 0, 1, -1);
sctotal = sctotal  + IIf(tskp_colortmplcnd7 > 0, 1, -1);
sctotal = sctotal  + IIf(tskp_colortmplcnd8 > 0, 1, -1);


for (curBar=0; curBar < BarCount-1; curBar++)
{

    if ( curBar == 0 )
    {
        CHiPr = haHigh[curBar];
        CHiBar = curBar;
        CLoPr = haLow[curBar];
        CLoBar = curBar;
        blsLong = 0;
        blsShort = 0;
        blsNewCO = 0;
        PrePP = 0;
        PrevCOBar = 0;
        PrevHiVal = haHigh[curBar];
        PrevLowVal = haLow[curBar];
        BuySig = 0;
        SellSig = 0;
        blsLL  = 0;
    }

    if (haHigh[CurBar] >= CHiPr) {
        CHiPr = haHigh[CurBar];
        ChiBar = CurBar;
    }

    if (haLow[CurBar] <= CLoPr) {
        CLoPr = haLow[CurBar];
        CLoBar = CurBar;
    }

    if ( (KPA900Val[curBar] >= KPAutoStopVal[curbar]) AND (PrePP != -1) AND (blsLong != 1) ){
        BarDif = CurBar - PrevCOBar;
        if (BarDif >= NumBars) {
            blsLong = 1;
            blsShort = 0;
            blsNewCO = 1;
            PrevCOBar = CurBar;
        }
    }

    if ( (KPA900Val[curBar] <= KPAutoStopVal[curbar]) AND (PrePP != 1) AND (blsShort != 1) ){
        BarDif = CurBar - PrevCOBar;
        if (BarDif >= NumBars) {
            blsLong = 0;
            blsShort = 1;
            blsNewCO = 1;
            PrevCOBar = CurBar;
        }
    }

    if ( (blsNewCO == 1) AND (sctotal[CurBar] >= 5) AND (blsLong == 1) ) {
        LVal = CurBar - CLoBar;
        for (j= CLoBar-1; j <= CLoBar+1; j++)
        {
            if (j >=0) {
                aLPivs[j] = 1;
                aLoVal[j] = CLoPr;
            }
        }
        PrePP = -1;
        blsNewCO = 0;
        CHiPr = haHigh[CurBar];
        CHiBar = CurBar;
        CLoPr = haLow[Curbar];
        CLoBar = CurBar;
        }
        else if ((blsNewCO == 1) AND (sctotal[CurBar] <= -5) AND (blsShort == 1) ) {
        HVal = CurBar - CHiBar;
        for (j= CHiBar-1; j <= CHiBar+1; j++)
        {
            if (j >=0) {
                aHPivs[j] = 1;
                aHiVal[j] = CHiPr;
            }
        }
        PrePP = 1;
        blsNewCO = 0;
        CHiPr = haHigh[CurBar];
        CHiBar = CurBar;
        CLoPr = haLow[Curbar];
        CLoBar = CurBar;
        }
}

PlotShapes(IIf(aHPivs == 1, shapeHollowSmallSquare,shapeNone), 25,0,   aHiVal+0.05,Offset = 6);
PlotShapes(IIf(aLPivs == 1, shapeHollowSmallSquare,shapeNone), colorCustom11,0, aLoVal-0.05, Offset = -6);

_SECTION_END();

_SECTION_BEGIN("TSKPMoMo");

blsLong = 0;

KPStopLine = E_TSKPSTOPLINE(High,Low,Close);
// tskp_upsell, tskp_triggerline, tskp_triggerlinevma
sw = E_TSKPUPSELL(Open,High,Low,Close,Volume);
KPTriggerLine = tskp_triggerline;
KPFast3Val = IIf((E_TSKPFAST3(Open,High,Low,Close,Volume)> 0),1, -1);
//tskp_fast2val1, tskp_fast2val2
dummy = E_TSKPFAST2(Open,High,Low,Close,Volume);
KPFast2Val = IIf ((tskp_fast2val1 > 0),1,-1);

Ctmpl = E_TSKPCOLORTMPL(Open,High,Low,Close,Volume);
sctotal = 0;
sctotal = sctotal  + IIf(tskp_colortmplcnd0 > 0, 1, -1);
sctotal = sctotal  + IIf(tskp_colortmplcnd1 > 0, 1, -1);
sctotal = sctotal  + IIf(tskp_colortmplcnd2 > 0, 1, -1);
sctotal = sctotal  + IIf(tskp_colortmplcnd3 > 0, 1, -1);
sctotal = sctotal  + IIf(tskp_colortmplcnd4 > 0, 1, -1);
sctotal = sctotal  + IIf(tskp_colortmplcnd5 > 0, 1, -1);
sctotal = sctotal  + IIf(tskp_colortmplcnd6 > 0, 1, -1);
sctotal = sctotal  + IIf(tskp_colortmplcnd7 > 0, 1, -1);
sctotal = sctotal  + IIf(tskp_colortmplcnd8 > 0, 1, -1);

// tskp_mediumma,tskp_mediumup,tskp_mediumdown
dummy = E_TSKPMEDIUM(Close);
KPMediumUP = tskp_mediumup;
KPMediumDwn = tskp_mediumdown;
KPMediumMA = tskp_mediumma;

// -- Create 0-initialized arrays the size of barcount
aHPivs = H - H;
aLPivs = L - L;
aHiVal = H - H;
aLoVal = L - L;


for (curBar=5; curBar < BarCount-1; curBar++)
{


    if( (blsLong == -1) OR (blsLong == 0))
      {
       if ((sctotal[CurBar]  >= 5) AND (KPMediumUP[CurBar]  > KPMediumMA[CurBar] ) AND (KPFast3Val[CurBar]  == 1) AND
        (KPFast2Val[CurBar]  == 1) AND (KPTriggerLine[CurBar]  >= KPStopLine[CurBar] ))
       {
         blsLong = 1;
          aLPivs[CurBar] = 1;
          aLoVal[CurBar] = Low[CurBar];
       }
    }

    if( (blsLong == 1) OR (blsLong == 0))
      {
       if ((sctotal[CurBar]  <= -5) AND (KPMediumDwn[CurBar]  < KPMediumMA[CurBar] ) AND (KPFast3Val[CurBar]  == -1) AND
       (KPFast2Val[CurBar]  == -1) AND (KPTriggerLine[CurBar]  <= KPStopLine[CurBar] ))
       {
         blsLong = -1;
         aHPivs[Curbar] = 1;
          aHiVal[Curbar] = High[Curbar];
       }
    }

    if ((blsLong == 1) AND ((sctotal[CurBar]  < 5) OR (KPMediumUP[CurBar]  < KPMediumMA[CurBar] )  OR
       (KPFast2Val[CurBar]  < 1)  OR  (KPFast3Val[CurBar]  < 1) OR (KPTriggerLine[CurBar]  < KPStopLine[CurBar] )) )
       {
           blsLong= 0;
        }

      if ((blsLong == -1) AND ((sctotal[CurBar]  > -5)  OR  (KPMediumDwn[CurBar] > KPMediumMA[CurBar] )  OR
         (KPFast2Val[CurBar]  > -1)  OR (KPFast3Val[CurBar]  > -1)  OR
         (KPTriggerLine[CurBar]  > KPStopLine[CurBar] )) )
         {
            blsLong = 0;
         }
}

PlotShapes (IIf(aHPivs == 1, shapeSmallCircle, shapeNone) ,colorOrange, layer = 0, yposition = haHigh, offset = 7 );
PlotShapes (IIf(aLPivs == 1, shapeSmallCircle, shapeNone) ,10, layer = 0, yposition = haLow, offset = -8 );

_SECTION_END();

_SECTION_BEGIN("Pivot");
nBars = Param("Number of bars", 12, 3, 40);
LP=Param("LookBack Period",150,1,500,1);
bShowTCZ = Param("Show TCZ", 0, 0, 1);
nExploreBarIdx = 0;
nExploreDate = 0;
nCurDateNum = 0;
DN = DateNum();
DT = DateTime();
bTCZLong = False;
bTCZShort = False;
nAnchorPivIdx = 0;
ADX8 = ADX(8);
if(Status("action")==1) {
    bDraw = True;
    bUseLastVis = 1;
} else {
    bDraw = False;
    bUseLastVis = False;
    bTrace = 1;
    nExploreDate = Status("rangetodate");
    for (i=LastValue(BarIndex());i>=0;i--) {
        nCurDateNum = DN[i];
        if (nCurDateNum == nExploreDate) {
            nExploreBarIdx = i;
        }
    }
}

if (bDraw) {
}
aHPivs = HaHigh - HaHigh;
aLPivs = HaLow - HaLow;
aHPivHighs = HaHigh - HaHigh;
aLPivLows = HaLow - HaLow;
aHPivIdxs = HaHigh - HaHigh;
aLPivIdxs = HaLow - HaLow;
aAddedHPivs = HaHigh - HaHigh;
aAddedLPivs = HaLow - HaLow;
aLegVol = HaHigh - HaHigh;
aRetrcVol = HaHigh - HaHigh;
nHPivs = 0;
nLPivs = 0;
lastHPIdx = 0;
lastLPIdx = 0;
lastHPH = 0;
lastLPL = 0;
curPivBarIdx = 0;
aHHVBars = HHVBars(HaHigh, nBars);
aLLVBars = LLVBars(HaLow, nBars);
aHHV = HHV(HaHigh, nBars);
aLLV = LLV(HaLow, nBars);
nLastVisBar = LastValue(
    Highest(IIf(Status("barvisible"), BarIndex(), 0)));
curBar = IIf(nlastVisBar > 0 AND bUseLastVis, nlastVisBar,
    IIf(Status("action")==4 AND nExploreBarIdx > 0, nExploreBarIdx,
    LastValue(BarIndex())));
curTrend = "";
if (aLLVBars[curBar] < aHHVBars[curBar])
    curTrend = "D";
else
    curTrend = "U";
if (curBar >= LP) {
    for (i=0; i<LP; i++) {
        curBar = IIf(nlastVisBar > 0 AND bUseLastVis,
            nlastVisBar-i,
            IIf(Status("action")==4 AND nExploreBarIdx > 0,
            nExploreBarIdx-i,
            LastValue(BarIndex())-i));
        if (aLLVBars[curBar] < aHHVBars[curBar]) {
            if (curTrend == "U") {
                curTrend = "D";
                curPivBarIdx = curBar - aLLVBars[curBar];
                aLPivs[curPivBarIdx] = 1;
                aLPivLows[nLPivs] = HaLow[curPivBarIdx];
                aLPivIdxs[nLPivs] = curPivBarIdx;
                nLPivs++;
            }
        } else {
            if (curTrend == "D") {
                curTrend = "U";
                curPivBarIdx = curBar - aHHVBars[curBar];
                aHPivs[curPivBarIdx] = 1;
                aHPivHighs[nHPivs] = HaHigh[curPivBarIdx];
                aHPivIdxs[nHPivs] = curPivBarIdx;
                nHPivs++;
            }
        }
    }
}
curBar =
    IIf(nlastVisBar > 0 AND bUseLastVis,
    nlastVisBar,
    IIf(Status("action")==4 AND nExploreBarIdx > 0,
    nExploreBarIdx,
    LastValue(BarIndex()))
    );
if (nHPivs >= 2 AND nLPivs >= 2) {
    lastLPIdx = aLPivIdxs[0];
    lastLPL = aLPivLows[0];
    lastHPIdx = aHPivIdxs[0];
    lastHPH = aHPivHighs[0];
    nLastHOrLPivIdx = Max(lastLPIdx, lastHPIdx);
    nAddPivsRng = curBar - nLastHOrLPivIdx;
    aLLVAfterLastPiv = LLV(HaLow, nAddPivsRng);
    nLLVAfterLastPiv = aLLVAfterLastPiv[curBar];
    aLLVIdxAfterLastPiv = LLVBars(HaLow, nAddPivsRng);
    nLLVIdxAfterLastPiv = curBar - aLLVIdxAfterLastPiv[curBar];
    aHHVAfterLastPiv = HHV(HaHigh, nAddPivsRng);
    nHHVAfterLastPiv = aHHVAfterLastPiv[curBar];
    aHHVIdxAfterLastPiv = HHVBars(HaHigh, nAddPivsRng);
    nHHVIdxAfterLastPiv = curBar - aHHVIdxAfterLastPiv[curBar];
    if (lastHPIdx > lastLPIdx) {


        if (aHPivHighs[0] < aHPivHighs[1]) {

            if (nLLVAfterLastPiv < aLPivLows[0] AND
                (nLLVIdxAfterLastPiv - lastHPIdx - 1) >= 1
                AND nLLVIdxAfterLastPiv != curBar   ) {

                // -- OK, we'll add this as a pivot.
                //    Mark it for plotting...
                aLPivs[nLLVIdxAfterLastPiv] = 1;
                aAddedLPivs[nLLVIdxAfterLastPiv] = 1;

                //    ...and then rearrange elements in the
                //    pivot information arrays
                for (j=0; j<nLPivs; j++) {
                    aLPivLows[nLPivs-j] = aLPivLows[nLPivs-(j+1)];
                    aLPivIdxs[nLPivs-j] = aLPivIdxs[nLPivs-(j+1)];
                }
                aLPivLows[0] = nLLVAfterLastPiv;
                aLPivIdxs[0] = nLLVIdxAfterLastPiv;
                nLPivs++;

            // -- Test whether to add piv given last piv is high
            //    AND we have lower highs
            }

        // -- Here, the last piv is a high piv, and we have
        //    higher-highs. The most likely addition is a
        //    Low piv that is a retracement.
        } else {

            if (nLLVAfterLastPiv > aLPivLows[0] AND
                (nLLVIdxAfterLastPiv - lastHPIdx - 1) >= 1
                AND nLLVIdxAfterLastPiv != curBar   ) {

                // -- OK, we'll add this as a pivot.
                //    Mark it for plotting...
                aLPivs[nLLVIdxAfterLastPiv] = 1;
                aAddedLPivs[nLLVIdxAfterLastPiv] = 1;

                //    ...and then rearrange elements in the
                //    pivot information arrays
                for (j=0; j<nLPivs; j++) {
                    aLPivLows[nLPivs-j] = aLPivLows[nLPivs-(j+1)];
                    aLPivIdxs[nLPivs-j] = aLPivIdxs[nLPivs-(j+1)];
                }
                aLPivLows[0] = nLLVAfterLastPiv;
                aLPivIdxs[0] = nLLVIdxAfterLastPiv;
                nLPivs++;

            // -- Test whether to add piv given last piv is high
            //    AND we have lower highs
            }
        // -- The last piv is a high and we have higher highs
        //    OR lower highs
        }

    /* ****************************************************************
        Still finding missed pivot(s). Here, the last piv is a low piv.
    **************************************************************** */


    } else {

        // -- First case, lower highs
        if (aHPivHighs[0] < aHPivHighs[1]) {

            if (nHHVAfterLastPiv < aHPivHighs[0] AND
                (nHHVIdxAfterLastPiv - lastLPIdx - 1) >= 1
                AND nHHVIdxAfterLastPiv != curBar   ) {

                // -- OK, we'll add this as a pivot.
                //    Mark that for plotting
                aHPivs[nHHVIdxAfterLastPiv] = 1;
                aAddedHPivs[nHHVIdxAfterLastPiv] = 1;

                //    ...and then rearrange elements in the
                //    pivot information arrays
                for (j=0; j<nHPivs; j++) {
                    aHPivHighs[nHPivs-j] = aHPivHighs[nHPivs-(j+1)];
                    aHPivIdxs[nHPivs-j] = aHPivIdxs[nhPivs-(j+1)];
                }
                aHPivHighs[0] = nHHVAfterLastPiv;
                aHPivIdxs[0] = nHHVIdxAfterLastPiv;
                nHPivs++;

            // -- Test whether to add piv given last piv is high
            //    AND we have lower highs
            }

        // -- Second case when last piv is a low piv, higher highs
        //    Most likely addition is high piv that is a retracement.
        //    Considering adding a high piv as long as it is higher
        } else {

            // -- Where I have higher highs,
            if (nHHVAfterLastPiv > aHPivHighs[0] AND
                (nHHVIdxAfterLastPiv - lastLPIdx - 1) >= 1
                AND nHHVIdxAfterLastPiv != curBar   ) {

                // -- OK, we'll add this as a pivot.
                //    Mark it for plotting...
                aHPivs[nHHVIdxAfterLastPiv] = 1;
                aAddedHPivs[nHHVIdxAfterLastPiv] = 1;

                //    ...and then rearrange elements in the
                //    pivot information arrays
                for (j=0; j<nHPivs; j++) {
                    aHPivHighs[nHPivs-j] = aHPivHighs[nHPivs-(j+1)];
                    aHPivIdxs[nHPivs-j] = aHPivIdxs[nhPivs-(j+1)];
                }
                aHPivHighs[0] = nHHVAfterLastPiv;
                aHPivIdxs[0] = nHHVIdxAfterLastPiv;
                nHPivs++;

            // -- Test whether to add piv given last piv is high
            //    AND we have lower highs
            }

        }

    }

// -- If there are at least two of each
}

/* ****************************************
// -- Done with finding pivots
***************************************** */


if (bDraw) {

    // -- OK, let's plot the pivots using arrows

PlotShapes( IIf(aAddedHPivs==1, shapeHollowSmallSquare, shapeNone), colorCustom12,layer = 0, yposition = HaHigh, offset = 13);
PlotShapes( IIf(aAddedLPivs==1, shapeHollowSmallSquare, shapeNone), colorYellow, layer = 0, yposition = HaLow, offset = -13);
}


/* ****************************************
// -- Done with discovering and plotting pivots
***************************************** */

// -- I'm going to want to look for possible retracement

risk = 0;
profInc = 0;
nLeg0Pts = 0;
nLeg0Bars = 0;
nLeg0Vol = 0;
nLeg1Pts = 0;
nLeg1Bars = 0;
nLeg1Vol = 0;
nLegBarsDiff = 0;
nRtrc0Pts = 0;
nRtrc0Bars = 0;
nRtrc0Vol = 0;
nRtrc1Pts = 0;
nRtrc1Bars = 0;
nRtrc1Vol = 0;

minRtrc = 0;
maxRtrc = 0;
minLine = 0;
maxLine = 0;
triggerLine = 0;
firstProfitLine = 0;
triggerInc = 0;
triggerPrc = 0;
firstProfitPrc = 0;
retrcPrc = 0;
retrcBar = 0;
retrcBarIdx = 0;
retrcRng = 0;
aRetrcPrc = HaHigh-HaHigh;
aRetrcPrcBars = HaHigh-HaHigh;
aRetrcClose = HaClose;
retrcClose = 0;

// -- Do TCZ calcs. Arrangement of pivs very specific
//    for this setup.
if (nHPivs >= 2 AND
    nLPivs >=2 AND
    aHPivHighs[0] > aHPivHighs[1] AND
    aLPivLows[0] > aLPivLows[1]) {

    tcz500 =
    (aHPivHighs[0] -
    (.5 * (aHPivHighs[0] - aLPivLows[1])));

    tcz618 =
    (aHPivHighs[0] -
    (.618 * (aHPivHighs[0] - aLPivLows[1])));

    tcz786 =
    (aHPivHighs[0] -
    (.786 * (aHPivHighs[0] - aLPivLows[0])));

    retrcRng = curBar  - aHPivIdxs[0];
    aRetrcPrc = LLV(HaLow, retrcRng);
    aRetrcPrcBars  = LLVBars(HaLow, retrcRng);

    retrcPrc = aRetrcPrc[curBar];
    retrcBarIdx = curBar - aRetrcPrcBars[curBar];
    retrcClose = aRetrcClose[retrcBarIdx];

    // -- bTCZLong setup?
    bTCZLong = (

        // -- Are retracement levels arranged in
        //    tcz order?

        // .500 is above .786 for long setups
        tcz500 >= (tcz786 * (1 - .005))
        AND
        // .681 is below .786 for long setups
        tcz618 <= (tcz786 * (1 + .005))
        AND

        // -- Is the low in the tcz range
        // -- Is the close >= low of tcz range
        //    and low <= high of tcz range
        retrcClose >= ((1 - .01) *  tcz618)
        AND
        retrcPrc <= ((1 + .01) *  tcz500)
        );

        // -- risk would be high of signal bar minus low of zone
        //risk = 0;

// -- lower highs and lower lows
} else if (nHPivs >= 2 AND nLPivs >=2
    AND aHPivHighs[0] < aHPivHighs[1]
    AND aLPivLows[0] < aLPivLows[1]) {

    tcz500 = (aHPivHighs[1] - (.5 * (aHPivHighs[1] - aLPivLows[0])));

    tcz618 = (aHPivHighs[0] - (.618 * (aHPivHighs[1] - aLPivLows[0])));

    tcz786 = (aHPivHighs[0] - (.786 * (aHPivHighs[0] - aLPivLows[0])));

    retrcRng = curBar  - aLPivIdxs[0];
    aRetrcPrc = HHV(HaHigh, retrcRng);
    retrcPrc = aRetrcPrc[curBar];
    aRetrcPrcBars  = HHVBars(HaHigh, retrcRng);
    retrcBarIdx = curBar - aRetrcPrcBars[curBar];
    retrcClose = aRetrcClose[retrcBarIdx];

    bTCZShort = (
        // -- Are retracement levels arranged in
        //    tcz order?

        // .500 is below .786 for short setups
        tcz500 <= (tcz786 * (1 + .005)) AND
        // .681 is above .786 for short setups
        tcz618 >= (tcz786 * (1 - .005)) AND

        // -- Is the close <= high of tcz range
        //    and high >= low of tcz range
        retrcClose <= ((1 + .01) *  tcz618) AND retrcPrc >= ((1 - .01) *  tcz500) );

        // -- Risk would be top of zone - low of signal bar
        //risk = 0;
}

// -- Show zone if present
if (bTCZShort OR bTCZLong) {

    // -- Be prepared to see symmetry
    if (bTCZShort) {
        if (aLPivIdxs[0] > aHPivIdxs[0]) {
            // -- Valuable, useful symmetry information
            nRtrc0Pts = aHPivHighs[0] - aLPivLows[1];
            nRtrc0Bars = aHPivIdxs[0] - aLPivIdxs[1] + 1;
            nRtrc1Pts = retrcPrc - aLPivLows[0];
            nRtrc1Bars = retrcBarIdx - aLPivIdxs[0] + 1;
        } else {
            nRtrc0Pts = aHPivHighs[1] - aLPivLows[1];
            nRtrc0Bars = aHPivIdxs[1] - aLPivIdxs[1] + 1;
            nRtrc1Pts = aHPivHighs[0] - aLPivLows[0];
            nRtrc1Bars = aHPivIdxs[0] - aLPivIdxs[0] + 1;
        }
    } else { // bLongSetup
        if (aLPivIdxs[0] > aHPivIdxs[0]) {
            nRtrc0Pts = aHPivHighs[0] - aLPivLows[1];
            nRtrc0Bars = aHPivIdxs[0] - aLPivIdxs[1] + 1;
            nRtrc1Pts = retrcPrc - aLPivLows[0];
            nRtrc1Bars = retrcBarIdx - aLPivIdxs[0] + 1;
        } else {
            nRtrc0Pts = aHPivHighs[1] - aLPivLows[0];
            nRtrc0Bars = aLPivIdxs[0] - aHPivIdxs[1] + 1;
            nRtrc1Pts = aHPivHighs[0] - aLPivLows[0];
            nRtrc1Bars = aLPivIdxs[0] - aHPivIdxs[0] + 1;
        }
    }

    if (bShowTCZ) {
        Plot(
            LineArray(  IIf(bTCZLong, aHPivIdxs[0], aLPivIdxs[0]),
            tcz500, curBar, tcz500 , 0),
            "tcz500", colorPaleBlue, styleLine);
        Plot(
            LineArray(  IIf(bTCZLong, aHPivIdxs[0], aLPivIdxs[0]),
            tcz618, curBar, tcz618, 0),
            "tcz618", colorPaleBlue, styleLine);
        Plot(
            LineArray(  IIf(bTCZLong, aHPivIdxs[0], aLPivIdxs[0]),
            tcz786, curBar, tcz786, 0),
            "tcz786", colorTurquoise, styleLine);
    }

// -- if (bShowTCZ)
}
  _SECTION_END();


W52_High=WriteVal(HHV(H,260),1.2);
W52_Low=WriteVal(LLV(L,260),1.2);


_SECTION_BEGIN("Fundamental data");

declara=GetFnData("LastSplitDate" );
declara1=GetFnData("DividendPayDate" ); // yahoo.format


//=================Trend & Signals ===============================
/// Please replace "NIFTY 50" with your market index ticker and activate the codes

/// Market Bull Bear

Cg = Foreign("NIFTY 50", "C");
Cgo= Ref(Cg,-1);

//Longterm Bullish or Bearish
Bullg = Cg > WMA(Cg,200);
Bearg= Cg <WMA(Cg,200);

//Midterm Bullish or Bearish
mBullg = Cg >WMA(Cg,50);
mBearg= Cg <WMA(Cg,50);

//Shortterm Bullish or Bearish
sBullg = Cg >WMA(Cg,15);
sBearg= Cg <WMA(Cg,15);
////////////////////////////////

xChange1=Cg - Ref(Cg,-1);
Change1 = StrFormat("%1.2f ",xChange1);
barche1= xChange1>=0;
Comche1= xChange1<0;
xperchange1 = xChange1/100;
perchange1 = StrFormat("%1.2f ",xperchange1);
positivechange1 = xperchange1>0;
negativechange1 = xperchange1<0;

//=================Trend & Signals ===============================
function T3(price,periods) //AMA-based
{
s=Param("Hot ?",0.618,0,100,0.001,0);
periods = 2/(periods+1);
e1=AMA(price,periods);
e2=AMA(e1,Periods);
e3=AMA(e2,Periods);
e4=AMA(e3,Periods);
e5=AMA(e4,Periods);
e6=AMA(e5,Periods);
c1=-s*s*s;
c2=3*s*s+3*s*s*s;
c3=-6*s*s-3*s-3*s*s*s;
c4=1+3*s+s*s*s+3*s*s;
Ti3=c1*e6+c2*e5+c3*e4+c4*e3;
return ti3;
}
P = ParamField("Price field");
periods = Param( "Periods", 3, 1, 100, 1 );

//Longterm Bullish or Bearish
//Bull = C > T3(C,233);
//Bear= C < T3(C,233);

Bull = C > WMA(C,200);
Bear= C <WMA(C,200);

//Midterm Bullish or Bearish
//mBull = C > T3(C,55);
//mBear= C < T3(C,55);

mBull = C >WMA(C,50);
mBear= C <WMA(C,50);


//Shortterm Bullish or Bearish
//sBull = C > T3(C,15);
//sBear= C < T3(C,15);

sBull = C >WMA(C,15);
sBear= C <WMA(C,15);


//--------------------------------------------------------
//Long-term Price Trend(LTPT)

rc= C > EMA (C,50) AND C < EMA(C,200) AND EMA(C,50) < EMA(C,200);
ac= C > EMA (C,50) AND C > EMA(C,200) AND EMA(C,50) < EMA(C,200);
bl= C > EMA (C,50) AND C > EMA(C,200) AND EMA(C,50) > EMA(C,200);
wr= C < EMA (C,50) AND C > EMA(C,200) AND EMA(C,50) > EMA(C,200);
ds= C < EMA (C,50) AND C < EMA(C,200) AND EMA(C,50) > EMA(C,200);
br= C < EMA (C,50) AND C < EMA(C,200) AND EMA(C,50) < EMA(C,200);

//------------------------


//Trend Strength


_SECTION_BEGIN("JSB_Pic_DMX_3");

SetBarsRequired(100000, 100000);

JSB_InitLib();

range=Param( "Length ", 9, 0, 500);

aup = JSB_JDMX(C,range) > 0;
adown = JSB_JDMX(C,range) < 0;
achoppy = JSB_JDMX(C,range) < JSB_JDMXplus(C,range) AND JSB_JDMX(C,range) < JSB_JDMXminus(C,range);

adxBuy =  Cross(JSB_JDMXplus(C,range), JSB_JDMXminus(C,range));
adxSell = Cross(JSB_JDMXminus(C,range), JSB_JDMXplus(C,range));
adxBuy = ExRem(adxBuy, adxSell);
adxSell = ExRem(adxSell, adxBuy);
adxbuy1 = JSB_JDMXplus(C,range) > JSB_JDMXminus(C,range);
adxsell1 = JSB_JDMXminus(C,range)> JSB_JDMXplus(C,range);

//Plot( JSB_JDMXplus( Close, Length), "JDMXplus", colorGreen, styleLine);
//Plot( JSB_JDMXminus( Close, Length), "JDMXminus", colorRed, styleLine);
//Plot( JSB_JDMX( Close, Length), "JDMX", colorBlue, styleLine | styleOwnScale);
_SECTION_END();


_SECTION_BEGIN("Breakout Setting");
Buyperiods=Param("Breakout periods",5,1,100,1,1);
BuyBreakout= C>Ref(HHV(H,Buyperiods),-1);

Buyperiods2=Param("2 Breakout periods",17,1,100,1,1);
BuyBreakout2= Cross( C, Ref( HHV(H,Buyperiods2), -1 ) );

_SECTION_END();


/*

// Plots a 20 period Donchian channel
pds=5;
exitpds=5;
DonchianUpper =HHV(Ref(H,-1),pds);
DonchianLower = LLV(Ref(L,-1),exitpds);
//DonchianMiddle = (DonchianUpper+DonchianLower)/2;
a1=H>=DonchianUpper;
a2=C<=DonchianLower;

// Plots a 55 period Donchian channel
pds2=15;
exitpds2=15;
DonchianUpper2 =HHV(Ref(H,-1),pds2);
DonchianLower2 = LLV(Ref(L,-1),exitpds2);
d1=H>=DonchianUpper2;
d2=C<=DonchianLower2;

//PlotShapes( IIf( a1, shapeHollowSmallCircle, shapeNone ), 11, layer = 0, yposition = Hahigh, offset = 6);
//PlotShapes( IIf( d1, shapeHollowSmallSquare, shapeNone ), colorBrightGreen, layer = 0, yposition = Hahigh, offset = -6);

*/


//Price Volume Breakout: close greater than last close and volume at least twice as much 50-day MA
HIV = C > Ref (C,-1) AND V > (MA(V,15)*2);
LIV = C < Ref (C,-1) AND V < (MA(V,15)*2);

//------------------------------------------------------------


//Initial Buy Signal
Ibuy =  Cross(RSI(14), EMA(RSI(14),9));
Isell = Cross(EMA(RSI(14),9), RSI(14));
Ibuy = ExRem(Ibuy, ISell);
Isell = ExRem(ISell, Ibuy);
BlRSI = RSI(14) > EMA(RSI(14),9);
BrRSI = RSI(14) < EMA(RSI(14),9);


//Price Smoothing -T3
TBuy = Cross (T3(C,3), T3(C,5));
TSell =  Cross (T3(C,5), T3(C,3));
TBuy = ExRem(TBuy, TSell);
TSell = ExRem(TSell, TBuy);
T33 = T3(C,3) > T3(C,5);
T333 = T3(C,3) < T3(C,5);

//Tillson's Part (RSI Smoothing)
TillsonBuy = Cross (t3(RSI(9),3), t3(RSI(9),5));
TillsonSell =  Cross (t3(RSI(9),5), t3(RSI(9),3));
TB = t3(RSI(9),3)> t3(RSI(9),5);
TS = t3(RSI(9),3)< t3(RSI(9),5);


//ZerolagEMA & T-3 Crosses
P = ParamField("Price field",-1);
Periods = Param("Periods", 4, 2, 200, 1, 10 );
EMA1=EMA(P,Periods);
EMA2=EMA(EMA1,Periods);
Difference=EMA1-EMA2;
ZerolagEMA=EMA1+Difference;
ebuy = Cross(ZerolagEma, t3(ZerolagEma,3));
esell = Cross(t3(ZerolagEma,3), ZerolagEma);
ebuy1 = ZerolagEma > t3(ZerolagEma,3);
esell1= t3(ZerolagEma,3)>ZerolagEma;

//Stochastics Part
//StochBuy = Cross(StochK(9,3), StochD(9,3,3));
//StochSell = Cross (StochD(9,3,3), StochK(9,3));
//StBuy=StochK(9,3)>StochD(9,3,3);
//StSell=StochK(9,3)<StochD(9,3,3);

//Stochastics Part

StochKval = StochK(10,5);
StochDval = StochD(10,5,5);

StochBuy = Cross(StochK(10,5), StochD(10,5,5));
StochSell = Cross (StochD(10,5,5), StochK(10,5));

StBuy=StochK(10,5)>StochD(10,5,5);
StSell=StochK(10,5)<StochD(10,5,5);


//Filter = Buy OR Sell;
//Stochbuy_status=  WriteIf(StochBuy, "Buy", WriteIf(StochSell, "Sell", "No Signal"));
//Stoch_Col=IIf(StochBuy, colorGreen, IIf(StochSell, colorRed, colorLightGrey));
//PlotShapes( IIf( StochBuy, shapeSmallCircle, shapeNone ), 7, layer = 0, yposition = 0, offset = 0);
//PlotShapes(IIf(StochBuy AND StochKval<26,35,shapeNone),colorBrightGreen,layer = 0, yposition = 0, offset = -30);
//PlotShapes(IIf(StochBuy AND StochKval > 26,33,shapeNone),colorPaleBlue,layer = 0, yposition = 0, offset = -30);
//PlotShapes(IIf(StochSell AND StochKval>67,37,shapeNone),colorRed,layer = 0, yposition = 0, offset = 0);


//MACD Signal Crosses
MB= Cross (MACD(), Signal());
MS = Cross( Signal(), MACD());
MB = ExRem(MB, MS);
MS = ExRem(MS, MB);
MB1= MACD() > Signal();
MS1= MACD() < Signal();


//30 Week New High-New Low
HI2 = High > Ref(HHV(High,130),-1);
LI2 = Low < Ref(LLV(Low,130),-1);
HIV2=Ref(HHV(High,130),-1);
LIV2=Ref(LLV(Low,130),-1);

//52 Week New High-New Low
HI = High > Ref(HHV(High,260),-1);
LI = Low < Ref(LLV(Low,260),-1);
HIV1= Ref(HHV(High,260),-1);
LIV1=Ref(LLV(Low,260),-1);
//HI=H>HIV1;
//LI=L<LIV1;


//Wad: Larry Williams Acc/Distribution Status
TRH = IIf(Ref(C, -1) > H, Ref(C, -1), H);
TRL = IIf(Ref(C, -1) < L, Ref(C, -1), L);
ad = IIf(C > Ref(C, -1), C - TRL, IIf(C < Ref(C, -1), C - TRH, 0));
WAD = Cum(ad);
wu = wad > Ref(wad,-1);
wd = wad < Ref(wad,-1);
//wad_status=   WriteIf(wu, "Rising", WriteIf(wd, "Falling", "Neutral"));


//5 Year New High-New Low

pdyear    = Param("6-Month Back",1300,65,2600,65);
pdyear1=pdyear/260;
HI3 = High > Ref(HHV(High,pdyear),-1);
LI3 = Low < Ref(LLV(Low,pdyear),-1);
HIV3= Ref(HHV(High,pdyear),-1);
LIV3=Ref(LLV(Low,pdyear),-1);
//HI=H>HIV1;
//LI=L<LIV1;


//_SECTION_BEGIN("ZL W%R");

R = ((HHV(H,14) - C) /(HHV (H,14) -LLV (L,14))) *-100;
MaxGraph=10;
Period= 10;
EMA1= EMA(R,Period);
EMA2= EMA(EMA1,5);
Difference= EMA1 - EMA2;
ZeroLagEMA= EMA1 + Difference;
PR=100-abs(ZeroLagEMA);
MoveAvg=MA(PR,5);
ZBuy = Cross(PR,moveAvg) AND PR<30;
ZSell = Cross(moveAvg,PR) AND PR>70;
ZBuy1= PR>= MoveAvg AND PR>= Ref(PR,-1) ;
ZSell1=(PR < MoveAvg) OR PR>= MoveAvg AND PR< Ref(PR,-1) ;

_SECTION_END();

//----------------------------------------------------------------------------------------
//  Find Short Term Reversals - Closing Price, Hook, Island, Key, Open-Close
//  and Pivot Point Reversals using automatic analysis

/*Closing Price Reversals Automatic Analysis
by Larry Lovrencic*/
CPRbuy=O<(L+0.2*(H-L)) AND C>(H-0.2*(H-L)) AND H<Ref(H,-1) AND L<Ref(L,-1) AND C>Ref(C,-1);
CPRsell=O>(L+0.8*(H-L)) AND C<(H-0.8*(H-L)) AND H>Ref(H,-1) AND L>Ref(L,-1) AND C<Ref(C,-1);
/*Hook Reversals Automatic Analysis by Larry Lovrencic*/

HRbuy=O<(L+0.2*(H-L)) AND C>(H-0.2*(H-L)) AND H<Ref(H,-1) AND L>Ref(L,-1);
HRsell=O>(L+0.8*(H-L)) AND C<(H-0.8*(H-L)) AND H<Ref(H,-1) AND L>Ref(L,-1);
/*Island Reversals Automatic Analysis by Larry Lovrencic*/

IRbuy=Ref(L,-2)>Ref(H,-1) AND L>Ref(H,-1);
IRsell=Ref(H,-2)<Ref(L,-1) AND H<Ref(L,-1);

/*Key Reversals Automatic Analysis by Larry Lovrencic*/

KRbuy=O<Ref(C,-1) AND L<Ref(L,-1) AND C>Ref(H,-1);
KRsell=O>Ref(C,-1) AND H>Ref(H,-1) AND C<Ref(L,-1);

/*Open/Close Reversals Automatic Analysis by Larry Lovrencic*/

OCRbuy=O<(L+0.2*(H-L)) AND C>(H-0.2*(H-L)) AND H<Ref(H,-1) AND L<Ref(L,-1) AND C<Ref(C,-1);
OCRsell=O>(L+0.8*(H-L)) AND C<(H-0.8*(H-L)) AND H>Ref(H,-1) AND L>Ref(L,-1) AND C>Ref(C,-1);
/*Pivot Point Reversals Automatic Analysis
by Larry Lovrencic*/

PPRbuy=Ref(L,-1)<Ref(L,-2) AND Ref(L,-1)<L AND C>Ref(H,-1);
PPRsell=Ref(H,-1)>Ref(H,-2) AND Ref(H,-1)>H AND C<Ref(L,-1);

Buyr=Cover=CPRbuy OR HRbuy OR IRbuy OR KRbuy OR OCRbuy OR PPRbuy;
Sellr=Short=CPRsell OR HRsell OR IRsell OR KRsell OR OCRsell OR PPRsell;
Buyr=ExRem(Buyr,Sellr); Sellr=ExRem(Sellr,Buyr); Short=ExRem(Short,Cover); Cover=ExRem(Cover,Short);
Filter= CPRbuy OR CPRsell OR HRbuy OR HRsell OR IRbuy OR IRsell OR KRbuy OR KRsell OR OCRbuy OR OCRsell OR PPRbuy OR PPRsell;
Filter=Buyr OR Sellr OR Short OR Cover;

//-----------------------------------------------------------------------------


//_SECTION_BEGIN("MA-T3 Setting");
// Probable MA-T3 Cross-Oracle
p=Param("Cross Period 1",4,1,20,1); //4
MAp=T3(C,p);
k=Param("Cross Period 2",5,1,20,1);//6
MAk=T3(C,k);
y=p*T3(C,p)-(p-1)*Ref(T3(C,p-1),-1);
tClose=(p*(k-1)*T3(C,k-1)-k*(p-1)*T3(C,p-1))/(k-p);
DescCrossPrediction=Cross(tClose,C);
AscCrossPrediction=Cross(C,tClose);
ExpectMAcross=DescCrossPrediction OR AscCrossPrediction;
Confirmed=Cross(MAk,MAp) OR Cross(MAp,MAk);
UR=2*Highest(ROC(C,1));LR=2*Lowest(ROC(C,1));
Ucoeff=1+UR/100;Lcoeff=1+LR/100;
Filter=tClose<Lcoeff*C OR tClose>Ucoeff*C;
AddColumn(MAp,"MAp");
AddColumn(MAk,"MAk");
//Plot(C,"",7*Filter+1,64); //No. '64' designates price chart as candle
//Plot(MAp,"",7,1); //Red Line - The No. '4' designates the red color & No. '1'
//Plot(MAk,"",2,1); //Green Line - - The No. '4' designates the red color & No. '1'
bars=BarsSince(Cross(MAp,MAk) OR Cross(MAk,MAp));
expect=NOT(Filter);

orBuy=AscCrossPrediction;
orSell=DescCrossPrediction;
orBuy1=(C>tClose);
orSell1=(tClose>C);
_SECTION_END();

//AddColumn(ROC(V,1), "ROC Volume", 1.2, IIf(ROC(V,1) > 0, colorGreen, colorRed));

//ROC(V,1);
//IIf(ROC(V,1) > 0, colorGreen, colorRed);
Vol=(ROC(V,1));
CP=(ROC(C,1));


_SECTION_BEGIN("Bull vs Bear Volume");

C1 = Ref(C, -1);
uc = C > C1; dc = C <= C1;
ud = C > O; dd = C <= O;

green = 1; blue = 2; yellow = 3; red = 4; white = 5;
VType = IIf(ud,
         IIf(uc, green, yellow),
       IIf(dd,
         IIf(dc, red, blue), white));


/* green volume: up-day and up-close*/
gv = IIf(VType == green, V, 0);
/* yellow volume: up-day but down-close */
yv = IIf(VType == yellow, V, 0);
/* red volume: down-day and down-close */
rv = IIf(VType == red, V, 0);
/* blue volume: down-day but up-close */
bv = IIf(VType == blue, V, 0);

uv = gv + bv; uv1 = Ref(uv, -1); /* up volume */
dv = rv + yv; dv1 = Ref(dv, -1); /* down volume */

/* create moving average period parameters */
VolPer = Param("Adjust Vol. MA per.", 34, 1, 255, 1);
ConvPer = Param("Adjust Conv. MA per.", 9, 1, 255, 1);

/* create triple exponential moving avearges of separate up and down volume
moving averages */
MAuv = TEMA(uv, VolPer ); mauv1 = Ref(mauv, -1);
MAdv = TEMA(dv, VolPer ); madv1 = Ref(madv, -1);
MAtv = TEMA(V, VolPer );//total volume

/* Switch for Horizontal lines indicating current level of positive and
negative volume for ease in comparing to past highs/lows - toggle via
parmameter window */
OscillatorOnly = Param("Show Oscillator Only", 0, 0, 1, 1);
CompareBullVolume = Param("Show Bull Level", 1, 0, 1, 1);
if(CompareBullvolume AND !OscillatorOnly){
//Plot(SelectedValue(MAuv), "", colorGreen, styleLine);
}

CompareBearVolume = Param("Show Bear Level", 1, 0, 1, 1);
if(CompareBearVolume AND !OscillatorOnly){
//Plot(SelectedValue(MAdv), "", colorRed, styleLine);
}

/* Volume Segment Switches - toggle via parameter window */
bullvolume = Param("Show Bull Volume", 1, 0, 1, 1);
bearvolume = Param("Show Bear Volume", 1, 0, 1, 1);
totalvolume = Param("Show Total Volume", 1, 0, 1, 1);

/* plot volume lines and histograms if toggled on: */
bearToFront = Param("Show Bear Vol in Front", 0, 0, 1, 1);
if(bearToFront AND !OscillatorOnly){
//Plot(MAdv, "", colorRed, styleHistogram|styleNoLabel);
}
if(bullvolume AND !OscillatorOnly){
//Plot(MAuv, "Average Bull Volume", colorGreen, styleHistogram|styleNoLabel);
}
if(bearvolume AND !OscillatorOnly){
//Plot(MAdv, "Average Bear Volume", colorRed, styleHistogram|styleNoLabel);
}
if(totalVolume AND !OscillatorOnly){
//Plot(MAtv, "Total Volume", colorWhite, styleHistogram|styleNoLabel);
//Plot(MAtv, "", colorWhite, styleLine);
}
if(bullvolume AND !OscillatorOnly){
//Plot(MAuv, "", colorGreen, styleLine);
}
if(bearvolume AND !OscillatorOnly){
//Plot(MAdv, "", colorRed, styleLine);
}

/* better visibility of zero line: */
//Plot(0, "", colorBlue, 1);

/* Rise/Fall Convergence variables:  */
Converge = (TEMA(MAuv - MAdv, ConvPer));
Converge1 = Ref(Converge, -1);
ConvergeUp = Converge > Converge1;
ConvergeOver = Converge > 0;
rising = ConvergeUp AND ConvergeOver;
falling = !ConvergeUp AND ConvergeOver;

/* Rise/Fall Convergence Oscillator Switch  - toggle via parameter window -
(provides a better view of resulting combination of battling bull/bear volume
forces) */
convergenceOscillator = Param("Show Oscillator", 0, 0, 1, 1);
if(convergenceOscillator OR OscillatorOnly){
//Plot(Converge, "Bull/Bear Volume Convergence/Divergence", colorViolet,1|styleLeftAxisScale|styleNoLabel|styleThick);
//Plot(0,"", colorYellow, 1|styleLeftAxisScale|styleNoLabel);
}

/********************************************************
 Convergence Rise/Fall Shadows:

 (provides a more easily visible display of rising and falling  bull/bear
volume convergence) - toggle via parameter window

-posiitive Volume exceeding negative Volume: Light shadow
-negative volume exceeding positive volume: dark shadow
-if you use standard gray background - best shadows are:
-my greys: 14 = (216, 216, 216); 15 = (168, 168, 168));
-best substitute? using AB color constants?
-light: colorpalegreen; dark: colorRose;?
-(depends on your color scheme - customize to your tastes)
**********************************************************/

/* uncomment if you use my custom color greys: */
riseFallColor = IIf(rising, 14,15); //my custom shadow greys

/* comment out if you use my custom color gray shadows: */
/* riseFallColor = IIf(rising, colorPaleGreen,colorRose); */

/* Rise/Fall Convergence Plot Switch - toggle via parameter window */
riseFallShadows = Param("Show RiseFallShadows", 0, 0, 1, 1);
if(riseFallShadows){
//Plot(IIf(rising OR falling, 1, 0), "", riseFallColor,styleHistogram|styleArea|styleOwnScale|styleNoLabel);
}
_SECTION_END();

_SECTION_BEGIN("Haiken-Ashi");
//THE QUEST FOR RELIABLE CROSSOVERS

//LISTING 1
function ZeroLagTEMA( array, period )
{
 TMA1 = TEMA( array, period );
 TMA2 = TEMA( TMA1, period );
 Diff = TMA1 - TMA2;
 return TMA1 + Diff ;
}
haClose = ( haClose + haOpen + haHigh + haLow )/4;
period = Param("Avg. TEMA period", 55, 1, 100 );
ZLHa = ZeroLagTEMA( haClose, period );
ZLTyp = ZeroLagTEMA( Avg, period );
//Plot( ZLHa, "ZLTema(Ha,"+period+")", colorRed );
//Plot( ZLTyp, "ZLTema(Typ,"+period+")", colorGreen );
TMBuy = Cross( ZLTyp, ZLHa );
TMSell = Cross( ZLHa, ZLTyp );
TMBuy1= ZLTyp> ZLHa ;
TMSell1=ZLHa> ZLTyp ;

_SECTION_END();

//////////////////////////////////////////////////////////////////////////////////////////////////////////////////
//Volume Price Analysis AFL - VPA Version 1.0
//AFL by Karthikmarar. Detailed explanation available at www.vpanalysis.blogspot.com
//====================================================================================
_SECTION_BEGIN("Volume Price Analysis by Mr.Karthik ");
SetChartOptions(0,chartShowArrows|chartShowDates);
//=======================================================================================
DTL=Param("Linear regression period",60,10,100,10);
wbf=Param("WRB factor",1.5,1.3,2.5,.1);
nbf=Param("NRB factor",0.7,0.3,0.9,0.1);
TL=LinRegSlope(MA(C, DTL),2);
 Vlp=Param("Volume lookback period",30,20,300,10);
Vrg=MA(V,Vlp);
St = StDev(Vrg,Vlp);
Vp3 = Vrg + 3*st;
Vp2 = Vrg + 2*st;;
Vp1 = Vrg + 1*st;;
Vn1 = Vrg -1*st;
Vn2 = Vrg -2*st;
rg=(H-L);
arg=Wilders(rg,30);
wrb=rg>(wbf*arg);
nrb=rg<(nbf*arg);
Vl=V<Ref(V,-1) AND V<Ref(V,-2);
upbar=C>Ref(C,-1);
dnbar=C<Ref(C,-1);
Vh=V>Ref(V,-1) AND Ref(V,-1)>Ref(V,-2);
Cloc=C-L;
x=rg/Cloc;
x1=IIf(Cloc==0,arg,x);
Vb=V>Vrg OR V>Ref(V,-1);
ucls=x1<2;
dcls=x1>2;
mcls=x1<2.2 AND x1>1.8 ;
Vlcls=x1>4;
Vhcls=x1<1.35;
j=MA(C,5);
TLL=LinRegSlope(j,40) ;
Tlm=LinRegSlope(j,15) ;
tls=LinRegSlope(j,5);
mp=(H+L)/2;
_SECTION_END();
//==========================================================================================
utbar=wrb AND dcls AND tls>0 ;
utcond1=Ref(utbar,-1) AND dnbar ;
utcond2=Ref(utbar,-1) AND dnbar AND V>Ref(V,-1);
utcond3=utbar AND V> 2*Vrg;
trbar=Ref(V,-1)>Vrg  AND Ref(upbar,-1) AND Ref(wrb,-1) AND dnbar AND dcls AND wrb AND tll>0 AND H==HHV(H,10);
Hutbar=Ref(upbar,-1) AND Ref(V,-1)>1.5*Vrg AND dnbar AND dcls AND NOT wrb AND NOT utbar;
Hutcond=Ref(Hutbar,-1) AND dnbar AND dcls AND NOT utbar;
tcbar=Ref(upbar,-1) AND H==HHV(H,5)AND dnbar AND (dcls OR mcls) AND V>vrg AND NOT wrb AND NOT Hutbar ;
Scond1=(utcond1 OR utcond2 OR utcond3) ;
Scond2=Ref(scond1,-1)==0;
scond=scond1 AND scond2;
stdn0= tll<0 AND V>Ref(V,-1) AND Ref(dnbar,-1) AND upbar AND (ucls OR mcls) AND tls<0 AND tlm<0;
stdn= V>Ref(V,-1) AND Ref(dnbar,-1) AND upbar AND (ucls OR mcls) AND tls<0 AND tlm<0;
stdn1= tll<0 AND V>(vrg*1.5) AND Ref(dnbar,-1) AND upbar AND (ucls OR mcls)AND tls<0 AND tlm<0;
stdn2=tls<0 AND Ref(V,-1)<Vrg  AND upbar AND vhcls AND V>Vrg;
bycond1= stdn OR stdn1;
bycond= upbar  AND Ref(bycond1,-1);
stvol= L==LLV(L,5)  AND (ucls OR mcls) AND V>1.5*Vrg AND tll<0;
ndbar=upbar AND nrb AND Vl  AND dcls ;
nsbar=dnbar AND nrb AND Vl  AND dcls ;
nbbar= C>Ref(C,-1) AND Vl AND nrb AND x1<2;
nbbar= IIf(C>Ref(C,-1) AND V<Ref(V,-1) AND V<Ref(V,-2) AND x1<1.1,1,0);
lvtbar= vl AND L<Ref(L,-1) AND ucls;
lvtbar1= V<Vrg AND L<Ref(L,-1) AND ucls AND tll>0 AND tlm>0 AND wrb;
lvtbar2= Ref(Lvtbar,-1) AND upbar AND ucls;
dbar= V>2*Vrg AND dcls AND upbar AND tls>0 AND tlm>0 AND NOT Scond1 AND NOT utbar;
eftup=H>Ref(H,-1) AND L>Ref(L,-1) AND C>Ref(C,-1) AND C>=((H-L)*0.7+L) AND rg>arg AND V>Ref(V,-1);
eftupfl=Ref(eftup,-1) AND (utbar OR utcond1 OR utcond2 OR utcond3);
eftdn=H<Ref(H,-1) AND L<Ref(L,-1) AND C<Ref(C,-1) AND  C<=((H-L)*0.25+L) AND rg>arg AND V>Ref(V,-1);
_SECTION_END();

_SECTION_BEGIN("Commentary");
Vpc= utbar OR utcond1 OR utcond2 OR utcond3 OR stdn0 OR stdn1 OR stdn2 OR stdn OR lvtbar1 OR Lvtbar OR Lvtbar2 OR Hutbar OR Hutcond OR ndbar OR stvol OR tcbar;

if( Status("action") == actionCommentary )
(
printf ( "=========================" +"\n"));
printf ( "VOLUME PRICE ANALYSIS" +"\n");
printf ( "=========================" +"\n");
printf ( Name() + " - " +Interval(2) +  "  - " + Date() +" - " +"\n"+"High-"+H+"\n"+"Low-"+L+"\n"+"Open-"+O+"\n"+
"Close-"+C+"\n"+ "Volume= "+ WriteVal(V)+"\n");
WriteIf(Vpc,"=======================","");
WriteIf(Vpc,"VOLUME ANALYSIS COMMENTARY:\n","");

WriteIf(utbar , "Up-thrusts are designed to catch stops and to mislead as many traders as possible.
They are normally seen after there has been weakness in the background. The market makers know that the
market is weak, so the price is marked up to catch stops, encourage traders to go long in a weak market,
AND panic traders that are already Short into covering their very good position.","")+
WriteIf(utcond3,"This upthrust bar is at high volume.This is a sure sign of weakness. One may even seriously
consider ending the Longs AND be ready to reverse","")+WriteIf(utbar OR utcond3," Also note that A wide spread
down-bar that appears immediately after any up-thrust, tends to confirm the weakness (the market makers are
locking in traders into poor positions).
With the appearance of an upthrust you should
certainly be paying attention to your trade AND your stops. On many upthrusts you will find that the market will
'test' almost immediately.","")+WriteIf(utcond1 , "A wide spread down bar following a Upthrust Bar.
This confirms weakness. The Smart Money is locking in Traders into poor positions","");
WriteIf(utcond2 , "Also here the volume is high( Above Average).This is a sure sign of weakness. The Smart Money is
locking in Traders into poor positions","")+WriteIf(stdn, "Strength Bar. The stock has been in a down Trend. An upbar
with higher Volume closing near the High is a sign of strength returning. The downtrend is likely to reverse soon. ","")+
WriteIf(stdn1,"Here the volume is very much above average. This makes this indication more stronger. ","")+
WriteIf(bycond,"The previous bar saw strength coming back. This upbar confirms strength. ","")+
WriteIf(Hutbar," A pseudo Upthrust. This normally appears after an Up Bar with above average volume. This looks like an upthrust bar
closing down near the Low. But the Volume is normally Lower than average. this is a sign of weakness.If the Volume is High then weakness
increases. Smart Money is trying to trap the retailers into bad position. ","")+
WriteIf(Hutcond, "A downbar after a pseudo Upthrust Confirms weakness. If the volume is above average the weakness is increased. ","")+
WriteIf(Lvtbar2,"The previous bar was a successful Test of supply. The current bar is a upbar with higher volume. This confirms strength","")+
WriteIf(dbar,"A wide range, high volume bar in a up trend closing down is an indication the Distribution is in progress. The smart money
is Selling the stock to the late Comers rushing to Buy the stock NOT to be Left Out Of a Bullish move. ","")+
WriteIf(Lvtbar2,"The previous bar was a successful Test of supply. The current bar is a upbar with higher volume. This confirms strength","")+
WriteIf(tcbar,"The stock has been moving up on high volume. The current bar is a Downbar with high volume. Indicates weakness and probably end of the up move","")+
WriteIf(eftup,"Effort to Rise bar. This normally found in the beginning of a Markup Phase and is bullish sign.These may be found at the top of an Upmove as the Smart money makes a
last effort to move the price to the maximum","")+
WriteIf(eftdn,"Effort to Fall bar. This normally found in the beginning of a Markdown phase.","")+

WriteIf(nsbar,"No Supply. A no supply bar indicates supply has been removed and the Smart money can markup the price. It is better to wait for confirmation","")+
WriteIf(stvol,"Stopping Volume. This will be an downbar during a bearish period closing towards the Top accompanied by High volume.
A stopping Volume normally indicates that smart money is absorbing the supply which is a Indication that they are Bullishon the MArket.
Hence we Can expect a reversal in the down trend. ","")+
WriteIf(ndbar, "No Demand
Brief Description:
Any up bar which closes in the middle OR Low, especially if the Volume has fallen off,
is a potential sign of weakness.

Things to Look Out for:
if the market is still strong, you will normally see signs of strength in the next few bars,
which will most probably show itself as a:
* Down bar with a narrow spread, closing in the middle OR High.
* Down bar on Low Volume.","");
_SECTION_END();

//=====================================================================
//background stock name (works only on Amibroker version 5.00 onwards.
//=====================================================================

_SECTION_BEGIN("Mabiuts-Mr.Karthik");
mabBuy=EMA(C,13)>EMA(EMA(C,13),9) AND Cross (C,Peak(C,5,1));
mabSell=Cross (EMA(EMA(C,13),9),EMA(C,13));
mabBuy1= EMA(C,13)>EMA(EMA(C,13),9) AND C>Peak(C,2,1);
mabSell1 =EMA(C,13)>EMA(EMA(C,13),9) AND C<Peak(C,2,1);

_SECTION_END();

//------------------------------------------------------------------------------
//WEEKLY TREND

weeklyprice=C;
Weekly=ValueWhen(DayOfWeek() > Ref( DayOfWeek(),1),WeeklyPrice);

W6ema = EMA(weekly,30);// 6 weeks * 5 days per week - default 30
W13ema = EMA(weekly,65);// 13 weeks * 5 days per week - default 65
MACDSignal = EMA((W6ema - W13ema),25);// 5 weeks * 5 days per week default 25

ROCMACD = MACDSignal - Ref(MACDSignal,-25);//ROC of MACD Signal default 25

//Cond1 - "V" bottom, start of climb
Cond1 = IIf(ROCMACD > Ref(ROCMACD,-5)  AND Ref(ROCMACD,-5) <= Ref(ROCMACD,-10),1,0);
//Cond2 - "V" top, start of drop
Cond2 = IIf(ROCMACD < Ref(ROCMACD,-5)   AND Ref(ROCMACD,-5) >= Ref(ROCMACD,-10),1,0);
//cond3 - Steady up trend
Cond3 = IIf(ROCMACD> Ref(ROCMACD,-5) AND Ref(ROCMACD,-5) >= Ref(ROCMACD,-10),1,0);
//Cond4 - Steady down trend
Cond4 = IIf(ROCMACD < Ref(ROCMACD,-5) AND Ref(ROCMACD,-5) <= Ref(ROCMACD,-10),1,0);
//Cond5 - no change - flat
Cond5 = IIf(ROCMACD == Ref(ROCMACD,-5) ,1,0);
/////////////////////////////////////////////////////////////
_SECTION_END();

_SECTION_BEGIN("Weekly_trend-mrtq13");

//#include <T3.AFL>;

Prd1=Param("Weekly_Period1",3,1,200,1);
Prd2=Param("Weekly_Period2",5,1,200,1);

TimeFrameSet (inWeekly);

TM   = T3  ( Close , Prd1 ) ;
TM2  = T3 ( Close , Prd2 ) ;
UTM = IIf(Close>TM AND Close<TM2,8,
IIf(Close>TM AND Close>TM2,5,
IIf(Close<TM AND Close>TM2,13,
IIf(Close<TM AND Close<TM2,4,2))));

//up=Close>TM AND Close<TM2;
wup=Close>TM AND Close>TM2;
wflat=Close<TM AND Close>TM2;
wdown=Close<TM AND Close<TM2;
TimeFrameRestore();

_SECTION_END();


//Pivot Cal

Pp  =  ((High +Low + Close) / 3);
R1 = (Pp * 2) - Low;
R2 = (Pp + High) - Low;
R3 = R1 +(High-Low);

S1 = (Pp * 2) - High;
S2 = (Pp - High) + Low;
S3 = S1 - (High-Low);


_SECTION_BEGIN("Spiker_Shadow");

C1 = Ref(C, -1);
uc = C > C1; dc = C <= C1;
ud = C > O; dd = C <= O;

green = 1; blue = 2; yellow = 3; red = 4; white = 5;
VType = IIf(ud,
         IIf(uc, green, yellow),
       IIf(dd,
         IIf(dc, red, blue), white));

/* green volume: up-day and up-close*/
gv = IIf(VType == green, V, 0);
/* yellow volume: up-day but down-close */
yv = IIf(VType == yellow, V, 0);
/* red volume: down-day and down-close */
rv = IIf(VType == red, V, 0);
/* blue volume: down-day but up-close */
bv = IIf(VType == blue, V, 0);


uv = gv + bv; uv1 = Ref(uv, -1); /* up volume */
dv = rv + yv; dv1 = Ref(dv, -1); /* down volume */


VolPer = Param("Adjust Vol. MA per.", 34, 1, 255, 1);//12
ConvPer = Param("Adjust Conv. MA per.", 9, 1, 255, 1);//6


MAuv = TEMA(uv, VolPer ); mauv1 = Ref(mauv, -1);
MAdv = TEMA(dv, VolPer ); madv1 = Ref(madv, -1);
MAtv = TEMA(V, VolPer );//total volume


Converge = (TEMA(MAuv - MAdv, ConvPer));
Converge1 = Ref(Converge, -1);
ConvergeUp = Converge > Converge1;
ConvergeOver = Converge > 0;
rising = ConvergeUp AND ConvergeOver;
falling = !ConvergeUp AND ConvergeOver;

_SECTION_END();


_SECTION_BEGIN("VSA by Mr.Karthik");

Pp1=Param("NumberOfDays",30,1,200,1);
Pp2=Param("VolOfDays",15,1,200,1);

numDays = Pp1;
dwWideSpread = 1.8;
dwNarrowSpread = 0.8;
dwSpreadMiddle = 0.5;
dwHighClose = 0.7;
dwLowClose = 0.3;

volNumDays = Pp2;
dwUltraHighVol = 2;
dwVeryHighVol = 1.75; // was 1.8
dwHighVol = 1.75; // was 1.8
dwmoderateVol = 1.10; // was 1.8
dwLowVol = 0.75; // was 0.8
////////////////////////////////////////////////////////////////////////////////////
//
// Classify each bar...
//
////////////////////////////////////////////////////////////////////////////////////


upBar = C > Ref(C,-1);
downBar = C < Ref(C,-1);
spread = H-L;
avgRange = Sum(spread, numDays) / numDays;
wideRange = spread >= (dwWideSpread * avgRange);
narrowRange = spread <= (dwNarrowSpread * avgRange);
testHighClose = L + (spread * dwHighClose);
testLowClose = L + (spread * dwLowClose);
testCloseMiddle = L + (spread * dwSpreadMiddle);

upClose = C > testHighClose;
downClose = C < testLowClose;
middleClose = C >= testLowClose AND C <= testHighClose;

avgVolume = EMA(V, volNumDays);

highVolume = V > (avgVolume * dwHighVol);
moderateVol= V > (avgVolume * dwmoderateVol);
veryHighVolume = V > (avgVolume * dwVeryHighVol);
ultraHighVolume = V > (avgVolume * dwUltraHighVol);
LowVolume = V < (avgVolume * dwLowVol);


////////////////////////////////////////////////////////////////////////////////////
//
// direction and title
//
////////////////////////////////////////////////////////////////////////////////////


////////////////////////////////////////////////////////////////////////////////////
//
// Basic patterns...
//
////////////////////////////////////////////////////////////////////////////////////

upThrustBar = downClose AND H > Ref(H,-1) AND (C == L) AND downClose AND (NOT narrowRange);
noDemandBar = narrowRange AND LowVolume AND upBar AND (NOT upClose);
//noDemandBar = narrowRange AND LowVolume AND upBar AND (V < Ref(V,-1)) AND (V < Ref(V,-2));
noSupplyBar = narrowRange AND LowVolume AND downBar AND (V < Ref(V,-1)) AND (V < Ref(V,-2));
absorption = Ref(downbar, -1) AND Ref(highVolume, -1) AND upBar;
support = Ref(downBar,-1) AND (NOT Ref(downClose,-1)) AND Ref(highVolume,-1) AND upBar;
stoppingVolume = Ref(downBar,-1) AND Ref(highVolume,-1) AND C > testCloseMiddle AND (NOT downBar);
bullishsign=moderateVol+UpThrustBar;//OR moderateVol+upBar;
//rallyEnd = (Ref(highVolume,-1) AND Ref(upBar,-1) AND wideRange AND downBar) OR
// (narrowRange AND highVolume AND H > Ref(HHV(H, 250), -1));


////////////////////////////////////////////////////////////////////////////////////
//
// Strength and Weakness
//
////////////////////////////////////////////////////////////////////////////////////

weakness = upThrustBar OR noDemandBar OR
(narrowRange AND (H > Ref(H,-1)) AND highVolume) OR
(Ref(highVolume,-1) AND Ref(upBar,-1) AND downBar AND (H < Ref(H,-1)));

_SECTION_END();


_SECTION_BEGIN("Resistance");

supres=ParamToggle("Sup_Res","No|Yes",1);
if(supres)
{


Prd1=Param("Res_Period1",2,0,200,1);

test   = TEMA  ( High , Prd1 ) ;

PK = test > Ref(test,-1) AND Ref(test,1) < High;//Peak
PKV0 = ValueWhen(PK,haHigh,0);//PeakValue0
PKV1 = ValueWhen(PK,haHigh,1);//PeakValue1
PKV2 = ValueWhen(PK,haHigh,2);//PeakValue2

MPK = PKV2 < PKV1 AND PKV1 > PKV0 ;//MajorPeak

MPKV = ValueWhen(Ref(MPK,-1) == 0 AND MPK == 1, PKV1,1); //MajorPeakValue
MPKD = ValueWhen(Ref(MPK,-1) == 0 AND MPK == 1, DateNum(),1); //MajorPeakDate
SD = IIf(DateNum() < LastValue(MPKD,lastmode = True ), Null, LastValue(MPKV,Lastmode = True));//SelectedDate
Plot(SD, "Resist1",  colorDarkOliveGreen,ParamStyle("ResStyle1",styleLine|styleNoTitle,maskAll));

MPKV2 = ValueWhen(Ref(MPK,-1) == 0 AND MPK == 1, PKV1,2); //MajorPeakValue
MPKD2 = ValueWhen(Ref(MPK,-1) == 0 AND MPK == 1, DateNum(),2); //MajorPeakDate
SD2 = IIf(DateNum() < LastValue(MPKD2,lastmode = True ), Null, LastValue(MPKV2,Lastmode = True));//SelectedDate
Plot(SD2, "Resist2",  colorDarkOliveGreen,ParamStyle("ResStyle2",styleLine|styleNoTitle,maskAll));


MPKV3 = ValueWhen(Ref(MPK,-1) == 0 AND MPK == 1, PKV1,3); //MajorPeakValue
MPKD3 = ValueWhen(Ref(MPK,-1) == 0 AND MPK == 1, DateNum(),3); //MajorPeakDate
SD3 = IIf(DateNum() < LastValue(MPKD3,lastmode = True ), Null, LastValue(MPKV3,Lastmode = True));//SelectedDate
Plot(SD3, "Resist3", colorDarkOliveGreen,ParamStyle("ResStyle3",styleLine|styleNoTitle,maskAll));


MPKV4 = ValueWhen(Ref(MPK,-1) == 0 AND MPK == 1, PKV1,4); //MajorPeakValue
MPKD4 = ValueWhen(Ref(MPK,-1) == 0 AND MPK == 1, DateNum(),4); //MajorPeakDate
SD4 = IIf(DateNum() < LastValue(MPKD4,lastmode = True ), Null, LastValue(MPKV4,Lastmode = True));//SelectedDate
Plot(SD4, "Resist4",  colorDarkOliveGreen,ParamStyle("ResStyle4",styleLine|styleNoTitle,maskAll));


MPKV5 = ValueWhen(Ref(MPK,-1) == 0 AND MPK == 1, PKV1,5); //MajorPeakValue
MPKD5 = ValueWhen(Ref(MPK,-1) == 0 AND MPK == 1, DateNum(),5); //MajorPeakDate
SD5 = IIf(DateNum() < LastValue(MPKD5,lastmode = True ), Null, LastValue(MPKV5,Lastmode = True));//SelectedDate
Plot(SD5, "Resist5",  colorDarkOliveGreen,ParamStyle("ResStyle5",styleLine|styleNoTitle,maskAll));


MPKV6 = ValueWhen(Ref(MPK,-1) == 0 AND MPK == 1, PKV1,6); //MajorPeakValue
MPKD6 = ValueWhen(Ref(MPK,-1) == 0 AND MPK == 1, DateNum(),6); //MajorPeakDate
SD6 = IIf(DateNum() < LastValue(MPKD6,lastmode = True ), Null, LastValue(MPKV6,Lastmode = True));//SelectedDate
Plot(SD6, "Resist6", colorDarkOliveGreen ,ParamStyle("ResStyle6",styleLine|styleNoTitle,maskAll));


_SECTION_END();


_SECTION_BEGIN("Support");
//SP=L > Ref(L,-1) AND Ref(L,1) < L;//Peak

Prd2=Param("Sup_Period1",2,0,200,1);

test2   = TEMA ( Low , Prd2 ) ;

SP = Ref(test2,1) > Low AND test2 < Ref(test2,-1);//Peak
SPV0 = ValueWhen(SP,haLow,0);//PeakValue0
SPV1 = ValueWhen(SP,haLow,1);//PeakValue1
SPV2 = ValueWhen(SP,haLow,2);//PeakValue2

//PKV5 = ValueWhen(PK,haHigh,5);//PeakValue5
//PKV6 = ValueWhen(PK,haHigh,6);//PeakValue6

MSP = SPV2 > SPV1 AND SPV1 < SPV0 ;//MajorPeak

MSPV = ValueWhen(Ref(MSP,-1) == 0 AND MSP == 1, SPV1,1);
MSPD = ValueWhen(Ref(MSP,-1) == 0 AND MSP == 1, DateNum(),1);
SD = IIf(DateNum() < LastValue(MSPD,lastmode = True ), Null, LastValue(MSPV,Lastmode = True));
Plot(SD,"Support1",  colorPlum,ParamStyle("SupportLine1",styleLine|styleNoTitle,maskAll));


MSPV2 = ValueWhen(Ref(MSP,-1) == 0 AND MSP == 1, SPV1,2);
MSPD2 = ValueWhen(Ref(MSP,-1) == 0 AND MSP == 1, DateNum(),2);
SD2 = IIf(DateNum() < LastValue(MSPD2,lastmode = True ), Null, LastValue(MSPV2,Lastmode = True));
Plot(SD2,"Support2",  colorPlum,ParamStyle("SupportLine2",styleLine|styleNoTitle,maskAll));


MSPV3 = ValueWhen(Ref(MSP,-1) == 0 AND MSP == 1, SPV1,3);
MSPD3 = ValueWhen(Ref(MSP,-1) == 0 AND MSP == 1, DateNum(),3);
SD3 = IIf(DateNum() < LastValue(MSPD3,lastmode = True ), Null, LastValue(MSPV3,Lastmode = True));
Plot(SD3,"Support3",  colorPlum,ParamStyle("SupportLine3",styleLine|styleNoTitle,maskAll));


MSPV4 = ValueWhen(Ref(MSP,-1) == 0 AND MSP == 1, SPV1,4);
MSPD4 = ValueWhen(Ref(MSP,-1) == 0 AND MSP == 1, DateNum(),4);
SD4 = IIf(DateNum() < LastValue(MSPD4,lastmode = True ), Null, LastValue(MSPV4,Lastmode = True));
Plot(SD4,"Support4",  colorPlum,ParamStyle("SupportLine4",styleLine|styleNoTitle,maskAll));


MSPV5 = ValueWhen(Ref(MSP,-1) == 0 AND MSP == 1, SPV1,5);
MSPD5 = ValueWhen(Ref(MSP,-1) == 0 AND MSP == 1, DateNum(),5);
SD5 = IIf(DateNum() < LastValue(MSPD5,lastmode = True ), Null, LastValue(MSPV5,Lastmode = True));
Plot(SD5,"Support5",  colorPlum,ParamStyle("SupportLine5",styleLine|styleNoTitle,maskAll));


MSPV6 = ValueWhen(Ref(MSP,-1) == 0 AND MSP == 1, SPV1,6);
MSPD6 = ValueWhen(Ref(MSP,-1) == 0 AND MSP == 1, DateNum(),6);
SD6 = IIf(DateNum() < LastValue(MSPD6,lastmode = True ), Null, LastValue(MSPV6,Lastmode = True));
Plot(SD6,"Support6",  colorPlum,ParamStyle("SupportLine6",styleLine|stylehidden|styleNoTitle,maskAll));

}

_SECTION_END();


_SECTION_BEGIN("Pivot Box");

Hi=Param("High_Period",7,1,50,1);
Lo=Param("Low_Period",7,1,50,1);
A1=ExRemSpan(Ref(High,-2)==HHV(High,Hi),3);
A2=ExRemSpan(Ref(Low,-2)==LLV(Low,Lo),3);
A3=Cross(A1,0.9);
A4=Cross(A2,0.9);
TOP=Ref(haHigh,-BarsSince(A3));
YY1=TOP;
bot=Ref(haLow,-BarsSince(A4));
XX1=bot;
/////////////////

_SECTION_BEGIN("Beta Adjusted Trailing Stops-P.Kaufman& Bullkowski ");

dif=Ref(High,0)-Ref(Low,0);
dif1=Ref(High,-1)-Ref(Low,-1);
dif2=Ref(High,-2)-Ref(Low,-2);
dif3=Ref(High,-3)-Ref(Low,-3);
dif4=Ref(High,-4)-Ref(Low,-4);
dif5=Ref(High,-5)-Ref(Low,-5);
dif6=Ref(High,-6)-Ref(Low,-6);
dif7=Ref(High,-7)-Ref(Low,-7);
dif8=Ref(High,-8)-Ref(Low,-8);
dif9=Ref(High,-9)-Ref(Low,-9);
dif10=Ref(High,-10)-Ref(Low,-10);
dif11=Ref(High,-11)-Ref(Low,-11);
dif12=Ref(High,-12)-Ref(Low,-12);
dif13=Ref(High,-13)-Ref(Low,-13);
dif14=Ref(High,-14)-Ref(Low,-14);
dif15=Ref(High,-15)-Ref(Low,-15);
dif16=Ref(High,-16)-Ref(Low,-16);
dif17=Ref(High,-17)-Ref(Low,-17);
dif18=Ref(High,-18)-Ref(Low,-18);
dif19=Ref(High,-19)-Ref(Low,-19);
dif20=Ref(High,-20)-Ref(Low,-20);
dif21=Ref(High,-21)-Ref(Low,-21);

Sumdif=(dif+dif1+dif2+dif3+dif4+dif5+dif6+dif7+dif8+dif9+dif10+dif11+dif12+dif13+dif14+dif15+dif16+dif17+dif18+dif19+dif20+dif21)/22;


mp = Param("Multiplier",2,0.25,5,0.25);
Sumdifml=(Sumdif*1);
Sumdifml2=(Sumdif*1.5);
Sumdifml3=(Sumdif*mp);

Betastops=HHV(C,22) - Sumdifml;
Betastops2=HHV(C,22) - Sumdifml2;
Betastops3=HHV(C,22) - Sumdifml3;

//Plot(Betastops3, "BATS", ParamColor( "Color2", colorGold ),ParamStyle("Style2",styleThick,maskAll));


_SECTION_END();

// 33 bar high low
HIVg=Ref(HHV(High,33),1);
LIVg=Ref(LLV(Low,33),1);
Hchg=(C-HIVg)/HIVg*100;
Lchg=(C-LIVg)/LIVg*100;
Echg=(HIVg-C)/C*100;
_SECTION_END();

//x=Foreign("00DSEGEN","C");
//Cor=Correlation(C,x,14);

//Plot(Cor,"correlation index",colorWhite,styleLine);
//Plot(RelStrength("00DSEGEN",1),"strength",colorRed,styleLine|styleOwnScale);

_SECTION_END();


// Trend Detection

function Rise( Pd, perd, Pl, perl )
{
 MAD = DEMA(Pd,perd);
 MAL = LinearReg(Pl,perl);
 CondR = ROC(MAD,1)>0 AND ROC(MAL,1)>0;
 CondF = ROC(MAD,1)<0 AND ROC(MAL,1)<0;
 R[0] = C[0]>(H[0]+L[0])/2;

 for(i=1;i<BarCount;i++)
 {
  if( CondR[i] )
  {
   R[i] = 1;
  }
  else
  {
   if( CondF[i] )
   {
    R[i] = 0;
   }
   else
   {
    R[i] = R[i-1];
   }
  }
 }
 return R;
}

PrD = C;
PrL = H/2+L/2;
PrdD = PrdL = PrdM = Param("Prd",12,2,40,1);

permax = Max(prdd,prdl);

Rs = IIf( BarIndex()<permax, 0, Rise(PrD, PrdD, PrL, PrdL) );
Fs = IIf( BarIndex()<permax, 0, 1-Rs );

Confirm = MA(C,prdm);

function DirBar( dr, df )
{
B[0] = 0;

for(i=1;i<BarCount;i++)
{
 if( dr[i-1] && df[i]  )
 {
  B[i] = 1;
 }
 else
 {
  if( df[i-1] && dr[i] )
  {
   B[i] = 1;
  }
  else
  {
   B[i] = B[i-1] + 1;
  }
 }
}
return B;
}

Bs = DirBar( Rs, Fs );
Direction = ROC(Confirm,1) > 0 AND ROC(Confirm,5) > 0;
Downward = ROC(Confirm,1) < 0 AND ROC(Confirm,5) < 0;

Select = Rs AND Ref(Fs,-1);
Caution = Fs AND Ref(Rs,-1);

_SECTION_END();

Chg=Ref(C,-1);

Title = EncodeColor(colorYellow)+  Title = Name() + "    " + EncodeColor(2) + Date() +EncodeColor(11)+ "  " + EncodeColor(colorYellow)+ "{{INTERVAL}}" +
   EncodeColor(55)+ "   Open:  "+ EncodeColor(colorWhite)+ WriteVal(O,format=1.2) +
   EncodeColor(55)+ "   High:  "+ EncodeColor(colorWhite) + WriteVal(H,format=1.2) +
   EncodeColor(55)+ "   Low:  "+ EncodeColor(colorWhite)+ WriteVal(L,format=1.2) +
   EncodeColor(55)+ "   Close:  "+ WriteIf(C> Chg,EncodeColor(colorBrightGreen),EncodeColor(colorRed))+ WriteVal(C,format=1.2)+
   EncodeColor(55)+ "   Change:  "+ WriteIf(C> Chg,EncodeColor(colorBrightGreen),EncodeColor(colorRed))+ WriteVal(ROC(C,1),format=1.2)+ "%"+
   EncodeColor(55)+ "   Volume: "+ EncodeColor(colorWhite)+ WriteVal(V,1)


+"\n"+EncodeColor(colorPink)+"-----------------------------------------"
+"\n"+EncodeColor(colorOrange)+"The Foundation v 14.00"
+"\n"+EncodeColor(colorPink)+"-----------------------------------------"

+"\n"+EncodeColor(colorWhite)+"G.Index: "+ WriteIf(Cg>Cgo,EncodeColor(08),EncodeColor(04))+WriteVal(Cg,format=1.2)+WriteIf(positivechange1, EncodeColor(colorBrightGreen),"")+WriteIf(negativechange1,EncodeColor(colorRed), "")+" ( "+WriteIf(barche1,"\\c08"+Change1,"")+WriteIf(barche1,"\\c08 ","")+WriteIf(Comche1,"\\c04"+Change1,"")+ WriteIf(Comche1,"\\c04 ","")+""+") "

+"\n"+EncodeColor(colorWhite)+"Market Trend: "+ WriteIf(sBullg,EncodeColor(colorBrightGreen)+"UP",WriteIf(sBearg,EncodeColor(colorRed)+"Dwn",EncodeColor(colorYellow)+"Flat"))
+EncodeColor(colorWhite) + " | "
+ WriteIf(mBullg,EncodeColor(colorBrightGreen)+"UP",WriteIf(mBearg,EncodeColor(colorRed)+"Dwn",EncodeColor(colorYellow)+"Flat"))
+EncodeColor(colorWhite) + " | "
+ WriteIf(Bullg,EncodeColor(colorBrightGreen)+"UP",WriteIf(Bearg,EncodeColor(colorRed)+"Dwn",EncodeColor(colorYellow)+"Flat"))

+"\n"+EncodeColor(colorPink)+"----------------------------------------- "


+"\n"+EncodeColor(41)+"WeeklyTrend: " +WriteIf(wup,EncodeColor(colorBrightGreen)+"Up ", WriteIf(wdown,EncodeColor(colorRed)+"Down", WriteIf(wflat,EncodeColor(colorWhite)+"Flat ","")))
+EncodeColor(colorWhite)

//+"\n"+EncodeColor(25)+"WeeklyTrend:" + WriteIf(up,EncodeColor(colorBrightGreen)+"UP",WriteIf(down,EncodeColor(colorRed)+"Down",WriteIf(flat,EncodeColor(colorYellow)+"Flat","")))


+"\n"+EncodeColor(26)+"S.TermTrend: " + WriteIf(sBull,EncodeColor(colorBrightGreen)+"UP",WriteIf(sBear,EncodeColor(colorRed)+"Down","Neutral"))
+EncodeColor(colorWhite) + " | "
//+WriteIf(tls>0,EncodeColor(colorLime)+"UP",EncodeColor(colorRed)+"Down")

+WriteIf(Rs,EncodeColor(colorBrightGreen)+"UP",WriteIf(Fs,EncodeColor(colorRed)+"Down","Neutral"))
+"\n"+EncodeColor(26)+"M.TermTrend: " + WriteIf(mBull,EncodeColor(colorBrightGreen)+"UP",WriteIf(mBear,EncodeColor(colorRed)+"Down","Neutral"))
+EncodeColor(colorWhite) + " | "
+WriteIf(tlm>0,EncodeColor(colorLime)+"UP",EncodeColor(colorRed)+"Down")
+"\n"+EncodeColor(26)+"L.TermTrend: " + WriteIf(Bull,EncodeColor(colorBrightGreen)+"UP",WriteIf(Bear,EncodeColor(colorRed)+"Down","Neutral"))
+EncodeColor(colorWhite) + " | "
+WriteIf(tll>0,EncodeColor(colorLime)+"Up",EncodeColor(colorRed)+"Down")

+"\n"+EncodeColor(colorPink)+"---------------------------------------- "
//+"\n"+EncodeColor(47)+"Signal(IBuy): " + WriteIf(Ibuy,EncodeColor(colorBrightGreen)+"BuyWarning",WriteIf(Isell,EncodeColor(colorRed)+"SellWarning",WriteIf(BlRSI,EncodeColor(colorBrightGreen)+"BullishZone",WriteIf(BrRSI,EncodeColor(colorRed)+"BearishZone","Neutral"))))
+"\n"+EncodeColor(47)+"Signal(T3)   :   " + WriteIf(TBuy,EncodeColor(colorBrightGreen)+"Buy",WriteIf(TSell,EncodeColor(colorRed)+"Sell",WriteIf(T33,EncodeColor(colorBrightGreen)+"Bullish",WriteIf(T333,EncodeColor(colorRed)+"Bearish","Neutral"))))
+"\n"+EncodeColor(47)+"Signal(ZLW) :   " + WriteIf(ZBuy,EncodeColor(colorBrightGreen)+"Buy",WriteIf(ZSell,EncodeColor(colorRed)+"Sell",WriteIf(ZBuy1,EncodeColor(colorBrightGreen)+"Bullish",WriteIf(ZSell1,EncodeColor(colorRed)+"Bearish","Neutral"))))
//+"\n"+EncodeColor(47)+"Signal(Mab) :   " + WriteIf(mabBuy,EncodeColor(colorBrightGreen)+"Buy",WriteIf(mabSell,EncodeColor(colorRed)+"Sell",WriteIf(mabBuy1,EncodeColor(colorBrightGreen)+"Bullish",WriteIf(mabSell1,EncodeColor(47)+"Neutral",EncodeColor(colorRed)+"Bearish"))))
+"\n"+EncodeColor(47)+"Signal(TMA) :   " + WriteIf(TMBuy,EncodeColor(colorBrightGreen)+"Buy",WriteIf(TMSell,EncodeColor(colorRed)+"Sell",WriteIf(TMBuy1,EncodeColor(colorBrightGreen)+"Bullish",WriteIf(TMSell1,EncodeColor(colorRed)+"Bearish","Neutral"))))
+"\n"+EncodeColor(47)+"Signal(T3-RSI) : " + WriteIf(TillsonBuy,EncodeColor(colorBrightGreen)+"Buy",WriteIf(TillsonSell,EncodeColor(colorRed)+"Sell", WriteIf(TB,EncodeColor(colorBrightGreen)+"Bullish",WriteIf(TS,EncodeColor(colorRed)+"Bearish","Neutral"))))
+"\n"+EncodeColor(47)+"Signal(ADX) :   " + WriteIf(adxBuy,EncodeColor(colorBrightGreen)+"Buy",WriteIf(adxSell,EncodeColor(colorRed)+"Sell",WriteIf(adxBuy1,EncodeColor(colorBrightGreen)+"Bullish",WriteIf(adxSell1,EncodeColor(colorRed)+"Bearish","Neutral"))))
+"\n"+EncodeColor(47)+"Signal(MACD) : " + WriteIf(MB,EncodeColor(colorBrightGreen)+"Buy",WriteIf(MS,EncodeColor(colorRed)+"Sell",WriteIf(MB1,EncodeColor(colorBrightGreen)+"Bullish",WriteIf(MS1,EncodeColor(colorRed)+"Bearish","Neutral"))))
+"\n"+EncodeColor(47)+"Signal(Stoch) :  " + WriteIf(StochBuy,EncodeColor(colorBrightGreen)+"Buy",WriteIf(StochSell,EncodeColor(colorRed)+"Sell",WriteIf(StBuy,EncodeColor(colorBrightGreen)+"Bullish",WriteIf(StSell,EncodeColor(colorRed)+"Bearish","Neutral"))))
//+"\n"+EncodeColor(47)+"Signal(TM) : "+  WriteIf(orBuy,EncodeColor(colorBrightGreen)+"Buy",WriteIf(orSell,EncodeColor(colorRed)+"Sell",WriteIf(orBuy1,EncodeColor(colorBrightGreen)+"Bullish",WriteIf(orSell1,EncodeColor(colorRed)+"Bearish","Neutral"))))
//+"\n"+EncodeColor(47)+"Signal(Drava) : " + WriteIf(Buyrule,EncodeColor(colorBrightGreen)+"Buy",WriteIf(Sellrule,EncodeColor(colorRed)+"Sell",WriteIf(Buyrule1,EncodeColor(colorBrightGreen)+"Bullish",WriteIf(Sellrule1,EncodeColor(colorRed)+"Bearish","Neutral"))))
//+"\n"+EncodeColor(47)+"Signal(P5/15):" + WriteIf(Buybreakout,EncodeColor(colorBrightGreen)+"BreakOut1",WriteIf(Buybreakout2>Buybreakout,EncodeColor(colorBrightGreen)+"BreakOut2","Neutral"))
//+"\n"+EncodeColor(47)+"Signal(B):"+WriteIf(C>YY1,EncodeColor(colorBrightGreen)+"BreakOut",WriteIf(C<XX1,EncodeColor(colorRed)+"BreakDown","Neutral"))

+"\n"+EncodeColor(colorPink)+"----------------------------------------"
+"\n"+EncodeColor(07)+"Volume: "+WriteIf(V>Vp2,EncodeColor(colorLime)+"Very High",WriteIf(V>Vp1,EncodeColor(colorLime)+" High",WriteIf(V>Vrg,EncodeColor(colorLime)+"Above Average",
WriteIf(V<Vrg AND V>Vn1,EncodeColor(colorRed)+"Less than Average",WriteIf(V<Vn1,EncodeColor(colorRed)+"Low","")))))
+"\n"+EncodeColor(colorYellow)+"Spread: "+WriteIf(rg >(arg*2),EncodeColor(colorLime)+" Wide",WriteIf(rg>arg,EncodeColor(colorLime)+" Above Average",EncodeColor(colorRed)+" Narrow"))
+"\n"+EncodeColor(colorYellow)+"Close: "+WriteIf(Vhcls,EncodeColor(colorLime)+"Very High",WriteIf(ucls,EncodeColor(colorLime)+"High",WriteIf(mcls,EncodeColor(colorYellow)+"Mid",WriteIf(dcls,EncodeColor(colorRed)+"Down","Very Low"))))
+"\n"+EncodeColor(colorYellow) + "Zone : " +WriteIf(rising , EncodeColor(colorBrightGreen) + "Accumulation",WriteIf(falling , EncodeColor(colorCustom12) + "Distirbution",EncodeColor(colorAqua) + "Flat")) + " "
+"\n"+EncodeColor(colorYellow) + "Status : " +WriteIf(Weakness , EncodeColor(colorRed) + "Weak",WriteIf(stoppingVolume , EncodeColor(colorCustom12) + "StoppingVol",WriteIf(noSupplyBar , EncodeColor(colorLightOrange) + "NoSupply",WriteIf(support , EncodeColor(colorLightBlue) + "SupportVol",WriteIf(noDemandBar , EncodeColor(colorPink) + "NoDemand",WriteIf(absorption, EncodeColor(colorSkyblue) + "Absorption",WriteIf(upThrustBar, EncodeColor(colorBlue) + "Upthrust",WriteIf(bullishsign, EncodeColor(colorPaleGreen) + "STRONG",EncodeColor(colorTan) + "Neutral")))))))) + " "
+"\n"+EncodeColor(colorPink)+"----------------------------------------"
//+"\n"+EncodeColor(49)+"KeyReversal : " + WriteIf(Buyr,EncodeColor(colorBrightGreen)+"ReverseUP",WriteIf(Sellr,EncodeColor(colorRed)+"ReverseDown","Flat"))
//+"\n"+EncodeColor(49) +"Phaze(LTPT) : " + WriteIf(rc,EncodeColor(26)+"Recovery",WriteIf(ac,EncodeColor(colorGreen)+"Accumulation",WriteIf(bl,EncodeColor(colorBrightGreen)+"Bullish",WriteIf(wr,EncodeColor(colorOrange)+"Warning",WriteIf(ds,EncodeColor(colorRed)+"Distribution",WriteIf(br,EncodeColor(colorRed)+"Bearish","Neutral"))))))
//+"\n"+EncodeColor(49)+"T.Strength(ADX): "+StrFormat("%1.2f",ADX(per))  + WriteIf( PDI(per)>MDI(per),EncodeColor(colorBrightGreen)+ " UP",EncodeColor(colorRed)+" Down")
//+"\n"+EncodeColor(49)+"PV BreakOut : " + WriteIf(HIV,EncodeColor(colorBrightGreen)+"Positive",WriteIf(LIV,EncodeColor(colorRed)+"Negative","Neutral"))
//+"\n"+EncodeColor(49)+"A/D : " + WriteIf(wu,EncodeColor(colorBrightGreen)+"Accumulation",WriteIf(wd,EncodeColor(colorRed)+"Distribution","Neutral"))
//+"\n"+ EncodeColor(49) +"Vol Change:" + WriteIf(Vol>0,EncodeColor(08),EncodeColor(04)) +WriteVal(Vol,format=1.2)+ "%" +"\n"+EncodeColor(49)+"Vol: " + WriteIf(Buy,EncodeColor(colorBrightGreen)+"Buy",WriteIf(Sell,EncodeColor(colorRed)+"Sell",""))
//+WriteIf(MAuv>MAdv,EncodeColor(colorBrightGreen)+" : BullVol",WriteIf(MAuv<MAdv,EncodeColor(colorRed)+" : BearVol",": Neutral"))+WriteIf(rising,EncodeColor(colorBrightGreen)+" Rising",WriteIf(falling,EncodeColor(colorRed)+" Falling"," Flat"))
+"\n"+ EncodeColor(49) +"RSI: " +WriteIf(RSI(15)>30 AND RSI(15)<70,EncodeColor(08),WriteIf(RSI(15)<30 ,EncodeColor(07),EncodeColor(04))) + WriteVal(RSI(15),format=1.2) +WriteIf(RSI(15)>30 AND RSI(15)<70,"  Range"+EncodeColor(08),WriteIf(RSI(15)<30 ,"  OverSold"+EncodeColor(07),"  OverBought"+EncodeColor(04)))
//+(EncodeColor(colorYellow)+"  Close: ")+WriteIf(Vhcls,EncodeColor(colorLime)+"Very High",WriteIf(ucls,EncodeColor(colorLime)+"High",WriteIf(mcls,EncodeColor(colorYellow)+"Mid",WriteIf(dcls,EncodeColor(colorRed)+"Down","Very Low"))))
//+"\n"+EncodeColor(49)+"26 WHL: " +HIV2+" : "+LIV2+"-"+ WriteIf(H>HIV2,EncodeColor(colorBrightGreen)+"High",WriteIf(L<LIV2,EncodeColor(colorRed)+"Low","Neutral"))
//+"\n"+EncodeColor(49)+"52 WHL: " + HIV1+" : "+LIV1+" - "+WriteIf(H>HIV1,EncodeColor(colorBrightGreen)+"High",WriteIf(L<LIV1,EncodeColor(colorRed)+"Low","Neutral"))
//+"\n"+EncodeColor(49)+"HL:"+"("+pdyear1+" Yerars"+"):"+ HIV3+" :"+LIV3+"-"+WriteIf(H>HIV3,EncodeColor(colorBrightGreen)+"High",WriteIf(L<LIV3,EncodeColor(colorRed)+"Low","Neutral"))

+"\n"+EncodeColor(colorRose)+"----------------------------------------"
+"\n"+EncodeColor(02)+"BATS : "+ WriteIf(Betastops>C,EncodeColor(colorLightOrange)+"Exit-1","")+WriteIf(Betastops2>C,EncodeColor(colorOrange)+"| Exit-2","")+WriteIf(Betastops3>C,EncodeColor(colorRed)+" | Exit-3","")
+"\n"+EncodeColor(colorRose)+"----------------------------------------"
//+"\n"+EncodeColor(02)+"PivotPoint: "+StrFormat("%1.2f",Pp)
//+"\n"+EncodeColor(colorCustom11)+"R1 "+StrFormat("%1.2f",R1)+" R2 "+StrFormat("%1.2f",R2)+" R3 "+StrFormat("%1.2f",R3)
//+"\n"+EncodeColor(11)+"S1 "+StrFormat("%1.2f",S1)+" S2 "+StrFormat("%1.2f",S2)+" S3 "+StrFormat("%1.2f",S3)
//+"\n"+EncodeColor(colorRose)+"----------------------------------------"
//+"\n"+EncodeColor(11)+"FV : " //+  absFace_Value
//+EncodeColor(44)+" Lot : " //+ absMarket_Lot
//+EncodeColor(07)+"  CataGory: " //+ absMarket_Category
//+"\n"+EncodeColor(05)+"Electronic Share : "//+    absElectronic_Share
//+"\n"+EncodeColor(4)+"Last Declaration : "+ WriteVal(declara, formatDateTime )
//+"\n"+EncodeColor(4)+"Last Declaration : " //+ WriteVal(declara1, formatDateTime )//declara1// formatDateTime

+"\n"+EncodeColor(colorRose)+"================================"
+"\n"+EncodeColor(11)+"R1 "+StrFormat("%1.2f",R1)+" R2 "+StrFormat("%1.2f",R2)+" R3 "+StrFormat("%1.2f",R3)
+"\n"+EncodeColor(02)+"PivotPoint: "+StrFormat("%1.2f",Pp)
+"\n"+EncodeColor(colorCustom11)+"S1 "+StrFormat("%1.2f",S1)+" S2 "+StrFormat("%1.2f",S2)+" S3 "+StrFormat("%1.2f",S3)
+"\n"+EncodeColor(colorRose)+"================================";

_SECTION_END();


_SECTION_BEGIN("Name");
GfxSetOverlayMode(1);
GfxSelectFont("Tahoma", Status("pxheight")/8 );
GfxSetTextAlign( 6 );// center alignment
GfxSetTextColor( ColorHSB( 42, 42, 42 ) );
GfxSetBkMode(0); // transparent
GfxTextOut( Name(), Status("pxwidth")/2, Status("pxheight")/12 );
_SECTION_END();
11 comments
Leave Comment
Please login here to leave a comment.
Hello, thanks for the great work. However it doesn’t work. Where do you think I’m going wrong?
https://hizliresim.com/YA2SxC
Older unsupported Amibroker causing AFL error. Pls upgrade to 6.3 version.
Thanks for the great work
Thanks! İt’s work percet. Amazing indicator. Please give me e-mail adress. I have a great project that I want to talk to you about. @niladri
Hello Saban! Is this you? https://twitter.com/sabankaradeniz
Hello Niladri!
No, my mail adres sabankaradeniz@gmail.com
I have great codes. If it happens, it will be a great project.
plugins only provided for 32bit AB. Will not load with 64bit
old and complicated indicator. It has some useful parts that can be used
Replace 2 lines of code in AB 6.3 to correct errors.
Change1 = StrFormat("%1.2f% “,xChange1);
perchange1 = StrFormat(”%1.2f% “,xperchange1);
To:
Change1 = StrFormat(”%1.2f “,xChange1);
perchange1 = StrFormat(”%1.2f",xperchange1);
Hi Niladri ,
will this work on ami 5.60 pro ver
Any one can point me to 64bit plugins ? Thanks in advance,