Tertinggi dan terendah dengan jarak (0%-100%) dan explorasi. for Amibroker (AFL)
ARIES77 over 5 years ago Amibroker (AFL)
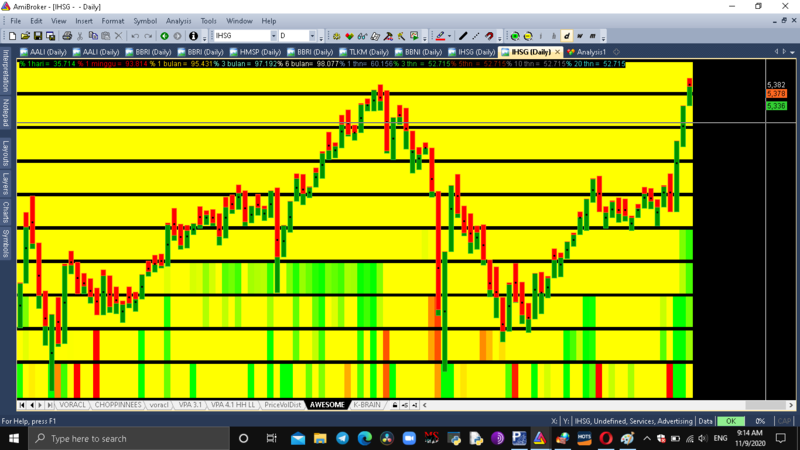
This Afl is used to see the candlestick on the chart to easily determine where the candlestick area is (highest or lowest), starting from the lowest/bottom column, which is 1 day, then 1 week and so on. red and green color as the percentage distance indicator from 0% to 100%, I just learned 5 months Amibroker Language Formula, so there must be a lot of mistakes. Please advice to improve this afl thank you.
note : – just drag drop to your chart
– when a trend creates daily highs (green) it may be a strong bullish trend
and vice versa
Screenshots
Indicator / Formula
Copy & Paste Friendly
Just dragdrop
//Tertinggi dan terendah dengan jarak (0%-100%) dan explorasi.
blankRightBars = 7;
barsInView = Status("lastvisiblebarindex") - Status("firstvisiblebarindex") - blankRightBars;
Offset = Param("Offset Bar", .2, 0, 1, .09);
textOffset = BarCount - (Offset * barsInView);


_SECTION_BEGIN("1 hari ");
H1 = HHV(H,1);
L1 = LLV(L,1);
P1DR = ( (Close - L1) / (H1 - L1) ) * 100;
R1 = (2500 - ( (P1DR/100)*2500 ) );
G1 = (P1DR/100)*2500;
Plot( 10, "", ColorRGB(R1,G1,0), styleArea|styleOwnScale|styleNoLabel, 0, 100);
Plot( 11,"",colorBlack,styleOwnScale|styleArea|styleNoLabel,0, 100 );

_SECTION_END();

_SECTION_BEGIN("5 hari ");
H5 = HHV(H,5);
L5 = LLV(L,5);
P5DR = ( (Close - L5) / (H5 - L5) ) * 100;
R5 = (2500 - ( (P5DR/100)*2500 ) );
G5 = (P5DR/100)*2500;
Plot( 20, "", ColorRGB(R5,G5,0), styleArea|styleOwnScale|styleNoLabel, 0, 100);
Plot( 21,"",colorBlack,styleOwnScale|styleArea|styleNoLabel,0, 100 );
_SECTION_END();

_SECTION_BEGIN("20 hari ");
H20 = HHV(H,20);
L20 = LLV(L,20);
P20DR = ( (Close - L20) / (H20 - L20) ) * 100;
R20 = (2500 - ( (P20DR/100)*2500 ) );
G20 = (P20DR/100)*2500;
Plot( 30, "", ColorRGB(R20,G20,0), styleArea|styleOwnScale|styleNoLabel, 0, 100);
Plot( 31,"",colorBlack,styleOwnScale|styleArea|styleNoLabel,0, 100 );
_SECTION_END();


_SECTION_BEGIN("60 hari");
H60 = HHV(H,60);
L60 = LLV(L,60);
P60DR = ( (Close - L60) / (H60 - L60) ) * 100;
R60 = (2500 - ( (P60DR/100)*2500 ) );
G60 = (P60DR/100)*2500;
Plot( 40, "", ColorRGB(R60,G60,0), styleArea|styleOwnScale|styleNoLabel, 0, 100);
Plot( 41,"",colorBlack,styleOwnScale|styleArea|styleNoLabel,0, 100 );
_SECTION_END();

_SECTION_BEGIN("120 hari");
H120 = HHV(H,120);
L120 = LLV(L,120);
P120DR = ( (Close - L120) / (H120 - L120) ) * 100;
R120 = (2500 - ( (P120DR/100)*2500 ) );
G120 = (P120DR/100)*2500;
Plot( 50, "", ColorRGB(R120,G120,0), styleArea|styleOwnScale|styleNoLabel, 0, 100);
Plot( 51,"",colorBlack,styleOwnScale|styleArea|styleNoLabel,0, 100 );
_SECTION_END();


_SECTION_BEGIN("240 hari");
H240 = HHV(H,240);
L240 = LLV(L,240);
P240DR = ( (Close - L240) / (H240 - L240) ) * 100;
R240 = (2500 - ( (P240DR/100)*2500) );
G240 = (P240DR/100)*2500;
Plot( 60, "", ColorRGB(R240,G240,0), styleArea|styleOwnScale|styleNoLabel, 0, 100);
Plot( 61,"",colorBlack,styleOwnScale|styleArea|styleNoLabel,0, 100 );

_SECTION_END();


_SECTION_BEGIN("720 hari");
H720 = HHV(H,720);
L720 = LLV(L,720);
P720DR = ( (Close - L720) / (H720 - L720) ) * 100;
R720 = (2500 - ( (P720DR/100)*2500 ) );
G720 = (P720DR/100)*2500;
Plot( 70, "", ColorRGB(R720,G720,0), styleArea|styleOwnScale|styleNoLabel, 0, 100);
Plot(71,"",colorBlack,styleOwnScale|styleArea|styleNoLabel,0, 100 );

_SECTION_END();

_SECTION_BEGIN("1200 hari");
H1200 = HHV(H,1200);
L1200 = LLV(L,1200);
P1200DR = ( (Close - L1200) / (H1200 - L1200) ) * 100;
R1200 = (2500 - ( (P1200DR/100)*2500) );
G1200 = (P1200DR/100)*2500;
Plot( 80, "", ColorRGB(R1200,G1200,0), styleArea|styleOwnScale|styleNoLabel, 0, 100);
Plot(81,"",colorBlack,styleOwnScale|styleArea|styleNoLabel,0, 100 );

_SECTION_END();

_SECTION_BEGIN("2400 hari");
H2400= HHV(H,2400);
L2400 = LLV(L,2400);
P2400DR = ( (Close - L2400) / (H2400 - L2400) ) * 100;
R2400 = (2500 - ( (P2400DR/100)*2500) );
G2400 = (P2400DR/100)*2500;
Plot( 90, "", ColorRGB(R2400,G2400,0), styleArea|styleOwnScale|styleNoLabel, 0, 100);
Plot(91,"",colorBlack,styleOwnScale|styleArea|styleNoLabel,0, 100 );

_SECTION_END();


_SECTION_BEGIN("4800 hari");
H4800= HHV(H,4800);
L4800 = LLV(L,4800);
P4800DR = ( (Close - L4800) / (H4800 - L4800) ) * 100;
R4800 = (2500 - ( (P4800DR/100)*2500) );
G4800 = (P4800DR/100)*2500;
Plot( 100, "", ColorRGB(R4800,G4800,0), styleArea|styleOwnScale|styleNoLabel, 0, 100);
Plot(101,"",colorBlack,styleOwnScale|styleArea|styleNoLabel,0, 100 );

_SECTION_END();


Title = EncodeColor(colorBrightGreen)+"% 1hari =" + WriteVal(P1DR) + EncodeColor(colorRed)+" % 1 minggu ="+ WriteVal(P5DR)+EncodeColor(colorGold)+" % 1 bulan =" + WriteVal(P20DR)+ EncodeColor(colorAqua)+"% 3 bulan =" + WriteVal(P60DR) + EncodeColor(colorLightYellow)+"% 6 bulan=" + WriteVal(P120DR)+ EncodeColor(colorLightBlue)+"% 1 thn=" + WriteVal(P240DR)+ EncodeColor(colorLime)+"% 3 thn  =" + WriteVal(P720DR)+ EncodeColor(colorBrown)+"% 5thn  =" + WriteVal(P1200DR)+ EncodeColor(colorGrey50)+"% 10 thn =" + WriteVal(P2400DR )+ EncodeColor(colorTurquoise)+"% 20 thn =" + WriteVal(P4800DR );

//EXPLORATION
_SECTION_BEGIN("");

Filter = 1;

AddColumn(P1DR,"1 hari");
AddColumn(P5DR," 1 minggu");
AddColumn(P20DR,"1 bulan");
AddColumn(P60DR,"3 bulan");
AddColumn(P120DR,"6 bulan");
AddColumn(P240DR,"1 tahun");
AddColumn(P720DR,"3 tahun");
AddColumn(P1200DR,"5 tahun");
AddColumn(P2400DR,"10 tahun");
AddColumn(P4800DR,"20 tahun");

_SECTION_END();
7 comments
Leave Comment
Please login here to leave a comment.
MANTAP
mantul bos
Good Heat map indicator
Apa ada yang punya daftar stock, nama dan watchlist untuk saham IDX?
Thank you sebelumnya…
Saya baru menggunakan Amibroker..Apa ada yang punya stock list dan watchlist IDX? Thank you
https://www.idx.co.id/data-pasar/ringkasan-perdagangan/ringkasan-saham/…coba di sini pak hasan tinggal pilih tanggal trus download
http://www.dataharianbei.com/… kalau ini tinggal download dan import wizard untuk bikin database baru dan googling aja cara bikin watchlist …bikin nya harus format txt atau pakai notepad … simpan dalam huruf capital (AALI ASII DST) hasil download dari idx dari link diatas…