Elliott Wave System for Amibroker (AFL)
songkoiu98gl over 5 years ago Amibroker (AFL)
I downloaded this file from Nalinsoni and did some adjustments. Hope it works for you.
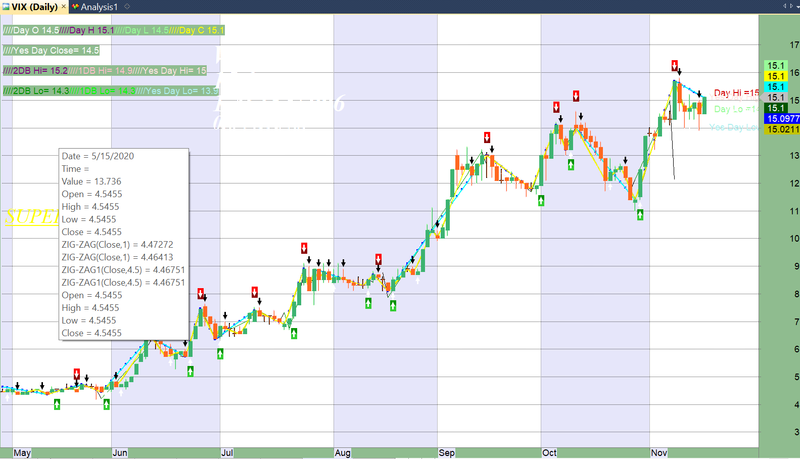
Screenshots
Indicator / Formula
Copy & Paste Friendly
//////////////////////////////////////////////////////////////////////////////////////////////////////////////////////////////////////////////

_SECTION_BEGIN( "Elliott Wave System" );

// my Mail ID  :  nalinsoni20000@gmail.com

GfxSetBkMode(1);
GfxSetTextColor( colorYellow);
GfxSelectFont( "Times New Roman", 20, 1, 500, True );
GfxTextOut( "SUPER System", 10 , 375 );

_SECTION_END();

//////////////////////////////////////////////////////////////////////////////////////////////////////////////////////////////////////////////

GraphXSpace=Param("GraphXSpace",15,-50,50,1);

//////////////////////////////////////////////////////////////////////////////////////////////////////////////////////////////////////////////

_SECTION_BEGIN("ZIG-ZAG");
P = ParamField( "ZIG Price field" );
change = Param("% change",1.0,0.25,25,0.25);

Color1 =(ParamColor("Slaller Elliott Wave1",colorYellow));
Plot( zz=DEMA(Zig(P, change),1), _DEFAULT_NAME(), Color1, styleLine+styleThick) ;

Color2 =(ParamColor("Slaller Elliott Wave2",ColorRGB(195, 195, 0 )));
Plot( zz=DEMA(Zig(P, change),2), _DEFAULT_NAME(), Color2, styleLine+styleThick) ;


Buy1  = Cross(DEMA(Zig(P, change), 1), MA(Zig(P, change), 2)) OR
        DEMA(Zig(P, change), 1) > MA(Zig(P, change), 2);

Sell1 = Cross(DEMA(Zig(P, change), 2), MA(Zig(P, change), 1)) OR
        DEMA(Zig(P, change), 2) > MA(Zig(P, change), 1);


BuyPrice1 =ValueWhen(Buy1,  (H+L)/2);
SellPrice1=ValueWhen(Sell1, (H+L)/2);


Buy1  = ExRem(Buy1,Sell1);
Sell1 = ExRem(Sell1,Buy1);


PlotShapes( shapeUpArrow *    Buy1, colorWhite, 0, Low  );
PlotShapes( shapeDownArrow * Sell1, colorBlack, 0, High );


//////////////////////////////////////////////////////////////////////////////////////////////////////////////////////////////////////////////


_SECTION_BEGIN("ZIG-ZAG1");
P1 = ParamField( "ZIG Price field" );
change1 = Param("% change1",4.5,0.25,25,0.25);

Color3 =(ParamColor("Larger Elliott Wave1",colorCustom11));
Plot( zz=TEMA(Zig(P1, change1),1), _DEFAULT_NAME(), Color3, styleLine+styleThick) ;

Color4 =(ParamColor("Larger Elliott Wave2",colorBlue));
Plot( zz=TEMA(Zig(P1, change1),2), _DEFAULT_NAME(), Color4, styleLine+styleDots+styleThick) ;

/*
Buy  = Cross(TEMA(Zig(P1, change1),1), TEMA(Zig(P1, change1),2)) ;
Sell = Cross(TEMA(Zig(P1, change1),2), TEMA(Zig(P1, change1),1)) ;


PlotShapes(IIf(Buy,  shapeSquare,  shapeNone),colorGreen,     0,L, Offset=-25);
PlotShapes(IIf(Buy,  shapeSquare,  shapeNone),colorLime,      0,L, Offset=-35);
PlotShapes(IIf(Buy,  shapeUpArrow, shapeNone),colorWhite,     0,L, Offset=-30);

PlotShapes(IIf(Sell, shapeSquare,  shapeNone),colorDarkRed,   0,H, Offset= 25);
PlotShapes(IIf(Sell, shapeSquare,  shapeNone),colorRed,       0,H, Offset= 35);
PlotShapes(IIf(Sell, shapeDownArrow,shapeNone),colorWhite,    0,H, Offset=-30);


BuyPrice =ValueWhen(Buy, (L+L+L+H)/4);
SellPrice=ValueWhen(Sell,(L+H+H+H)/4);


Buy  = ExRem(Buy,Sell);
Sell = ExRem(Sell,Buy);


if(SelectedValue(Buy))
{
	StaticVarSet( "tmp", 1 );
	PlaySound("C:\\Program Files\\AmiBroker\\sound\\buy.wav");
	Say("Buy Buy buy");
	SetChartBkColor(ColorRGB(143,188,143));
}
if(SelectedValue(Sell))
{
	StaticVarSet( "tmp", 0 );
	PlaySound("C:\\Program Files\\AmiBroker\\sound\\sell.wav");
	Say("sell sell sell");
	SetChartBkColor(ColorRGB(240,128,128));
}
if(StaticVarGet("tmp")==1)
{
	SetChartBkColor(ColorRGB(143,188,143));
}
else
{
	SetChartBkColor(ColorRGB(240,128,128));
}


if(Status("action") == actionExplore)


Filter = ( Buy OR Sell ) ;


SetOption("NoDefaultColumns", True);

AddTextColumn(Name(), "  S y m b o l  ");

AddColumn(DateTime(), "  D a t e  ", formatDateTime);

AddColumn(LastValue(C),"Currant",1.0,colorBlack,colorTan);

AddColumn( IIf( Buy, BuyPrice, Null ),   "Mega Buy by Larger Wave ",  1.2, textColor = colorWhite, bkgndColor = colorDarkGreen );


AddColumn( IIf( Sell, SellPrice, Null ), "Mega Sellby Larger Wave",  1.2, colorYellow, bkgndColor = colorViolet );
*/
//////////////////////////////////////////////////////////////////////////////////////////////////////////////////////////////////////////////

_SECTION_BEGIN("AUTO SEC Version 1.2");

//--Level 3
//Kook Auto SEC
//AUTO SEC Version 1.0//
// v.1.0 Created By Kook 16 Nov 2005 //
// v.1.1 1st Update By Kook 17 Nov 2005 //
// v.1.2 2nd Update By Kook 20 Nov 2005 //Bugs(Last SEC) reported from Mink

Heading="AUTO SEC Version 1.2";

SECUpColor=ParamColor("SEC-UpColor",colorGreen);
SECDnColor=ParamColor("SEC-DownColor",colorRed);
SECLastColor=ParamColor("SEC-LastColor",10);
BckGndColor=ParamColor("BackGroundColor",colorBlack);
ZZSwitch=Param("ZZSwitch",0,0,1,1);
Sens=Param("Sens",4.75, 0.5, 15, 0.25);
SECSwitch=Param("SECSwitch",1,0,1,1);

BarPK=BarsSince(Zig(C,Sens)==Peak(C,Sens));
BarTGH= BarsSince(Zig(C,Sens)==Trough(C,Sens));
Turnpoint=Min(BarPK,BarTGH);
x = Cum(1);
lastx = ValueWhen(Turnpoint==0,( x ));
Daysback = ValueWhen(Turnpoint==0,(Max(PeakBars(C,Sens,1),TroughBars(C,Sens,1))))+1;

aa =ValueWhen(Turnpoint==0,LinRegIntercept( Close, Daysback) );
bb =ValueWhen(Turnpoint==0,LinRegSlope( Close, Daysback));
y = Aa + bb * ( x - (Lastx - DaysBack+1) );

e= ValueWhen(Turnpoint==0,StdErr(C,Daysback));
eU= y + 2*e;
eL= y - 2*e;

ColorSEC=IIf(Cross(bb,0) OR Cross(0,bb),colorBlack,IIf(bb<0,colorRose,SECUpColor));

//Plot(IIf( x >= (lastx - Daysback), IIf( Ref(C,-1) <eU AND Ref(C,-1) >eL,y,Null) ,  -1e10 ) , "LinReg", colorSEC,1 );
//Plot(IIf( x >= (lastx - Daysback), IIf( Ref(C,-1) <eU AND Ref(C,-1) >eL,eU,Null) , -1e10 ) ,"",ColorSEC,1);
//Plot(IIf( x >= (lastx - Daysback), IIf( Ref(C,-1) <eU AND Ref(C,-1) >eL,eL,Null) , -1e10 ) ,"",ColorSEC,1);


//PlotShapes(shapeUpArrow*Cross(C,eU),colorWhite,0,L,Offset=-40);
//PlotShapes(shapeDownArrow*Cross(eL,C),colorWhite,0,H,Offset=-40);
//PlotShapes(shapeDigit3*Cross(C,eU),colorWhite,0,L,Offset=-55);
//PlotShapes(shapeDigit3*Cross(eL,C),colorWhite,0,H,Offset=55);

DaysbackL = LastValue(Min(PeakBars(C,Sens,1),TroughBars(C,Sens,1)));

Slope= ValueWhen(Turnpoint==0,bb,0);
Level= ValueWhen(Turnpoint==0,aa,0);
Err= ValueWhen(Turnpoint==0,e,0);

Mback= Level + slope*( Turnpoint) ;
Uback= MBack + 2*Err;
Lback= MBack - 2*Err;

ColorSEC2=IIf(Cross(bb,0) OR Cross(0,bb),colorBlack,IIf(bb<0,SECUpColor,colorRose));

//Plot( IIf( (X>(LastValue(x)-DaysbackL) ),Null ,Uback) ,"",ColorSEC2);
Plot( IIf( (X>(LastValue(x)-DaysbackL) ),Null ,Mback) ,"",ColorSEC2);
//Plot( IIf( (X>(LastValue(x)-DaysbackL) ),Null ,Lback) ,"",ColorSEC2);


Buy  = Cross(C,eU) OR C > eU;
Sell = Cross(eL,C) OR C < eU;


BuyPrice =ValueWhen(Buy, (L+L+L+H)/4);
SellPrice=ValueWhen(Sell,(L+H+H+H)/4);


Buy  = ExRem(Buy,Sell);
Sell = ExRem(Sell,Buy);


if(SelectedValue(Buy))
{
	StaticVarSet( "tmp", 1 );
	PlaySound("C:\\Program Files\\AmiBroker\\sound\\buy.wav");
	Say("Buy Buy buy");
	SetChartBkColor(ColorRGB(143,188,143));
}
if(SelectedValue(Sell))
{
	StaticVarSet( "tmp", 0 );
	PlaySound("C:\\Program Files\\AmiBroker\\sound\\sell.wav");
	Say("sell sell sell");
	SetChartBkColor(ColorRGB(240,128,128));
}
if(StaticVarGet("tmp")==1)
{
	SetChartBkColor(ColorRGB(143,188,143));
}
else
{
	SetChartBkColor(ColorRGB(240,128,128));
}

PlotShapes(IIf(Buy,  shapeSquare,  shapeNone),colorGreen,     0,L, Offset=-25);
PlotShapes(IIf(Buy,  shapeSquare,  shapeNone),colorLime,      0,L, Offset=-35);
PlotShapes(IIf(Buy,  shapeUpArrow, shapeNone),colorWhite,     0,L, Offset=-30);

PlotShapes(IIf(Sell, shapeSquare,  shapeNone),colorDarkRed,   0,H, Offset= 25);
PlotShapes(IIf(Sell, shapeSquare,  shapeNone),colorRed,       0,H, Offset= 35);
PlotShapes(IIf(Sell, shapeDownArrow,shapeNone),colorWhite,    0,H, Offset=-30);


if(Status("action") == actionExplore)


Filter = ( Buy OR Sell ) | ( Buy1 OR Sell1 );


SetOption("NoDefaultColumns", True);


AddTextColumn(Name(), "  S y m b o l  ");


AddColumn(DateTime(), "  D a t e  ", formatDateTime);


AddColumn(LastValue(C),"Currant",1.0,colorBlack,colorTan);


AddColumn( IIf( Buy, BuyPrice, Null ),   "Mega Buy by Larger Wave ",  1.2, textColor = colorWhite, bkgndColor = colorDarkGreen );

AddColumn( IIf( Buy1, BuyPrice1, Null ),  "Buy by Smaller Wave ",  1.2, textColor = colorWhite, bkgndColor = colorGreen );


AddColumn( IIf( Sell, SellPrice, Null ), "Mega Sellby Larger Wave",  1.2, colorYellow, bkgndColor = colorViolet );

AddColumn( IIf( Sell1, SellPrice1, Null ), "Sellby Smaller Wave",  1.2, colorYellow, bkgndColor = colorBrown );

_SECTION_END();

//////////////////////////////////////////////////////////////////////////////////////////////////////////////////////////////////////////////

_SECTION_BEGIN("In Daily Price");
SetChartOptions(0,chartShowArrows|chartShowDates);
_N(Title = StrFormat("{{NAME}} - {{INTERVAL}} {{DATE}} Open %g, Hi %g, Lo %g, Close %g (%.1f%%) {{VALUES}}",
           O, H, L, C, SelectedValue( ROC( C, 1 ) ) ));

TimeFrameSet(inDaily);
MA3 = MA(C,3);
Cl = C;
TimeFrameRestore();
MA3=(TimeFrameExpand( MA3, inDaily));
Cl=(TimeFrameExpand( Cl, inDaily));
barcolor =IIf(C > O , colorPaleGreen,IIf(C < O,colorPink, colorBlack ) );

PlotOHLC( IIf(Open<Close, Open, Close),High,Low,
           IIf(Open<Close, Close, Open), "Close", barColor, styleBar+styleThick+styleNoTitle );

_SECTION_END();

//////////////////////////////////////////////////////////////////////////////////////////////////////////////////////////////////////////////

_SECTION_BEGIN("Price, Hawamer");

SetBarsRequired(sbrAll);
daynum= Now(9);//day of the week
SatSun= IIf((daynum==1 OR daynum==7),1,0);
dec= IIf(StrRight(Name(),3) == "", 3.2, 3.2);
dec= (Param("Decimals",2,0,7,1)/10)+1;
uc= ParamColor("Up Candle Fill Color",19);
dc= ParamColor("Dn Candle Fill Color",24);
nc= ParamColor("Neutral Fill Color",16);
bc= BarCount-1;
x= BarIndex();
Lx= LastValue(x);
sx= SelectedValue(x);
//==============================
SetBarFillColor(IIf(C>O,ColorRGB(0, 230, 0),IIf(C<O,ColorRGB(230, 0, 0 ),nc)));
Plot(C,"",IIf(C>O,19,IIf(C<O,38,16)),64);

_SECTION_END();

//////////////////////////////////////////////////////////////////////////////////////////////////////////////////////////////////////////////

// Current Days Hi Lo //

numbars = LastValue( Cum( Status( "barvisible" ) ) );
fraction = IIf( StrRight( Name(), 3 ) == "", 3.2, 3.2 );

//THL = ParamToggle("Todays Hi Lo","Show|Hide",1);
//if(THL==1)
{
  isRth = TimeNum() >= 084500 & TimeNum() <= 085959;
  isdRth = TimeNum() >= 084500 & TimeNum() <= 160000;
  aRthL = IIf(isRth, L, 1000000);
  aRthH = IIf(isdRth, H, Null);
  aRthLd = IIf(isdRth, L, 1000000);


  DH = TimeFrameGetPrice( "H", inDaily );
  DHI = LastValue (DH,1);
  DL = TimeFrameGetPrice( "L", inDaily );
  DLI = LastValue (DL,1);

  PlotText(" Day Hi =" + WriteVal( DHI, fraction ), 	LastValue(BarIndex())+2, DHI  +0.05, ColorRGB(210, 0, 0 ));
  PlotText(" Day Lo =" + WriteVal( DLI, fraction ), 	LastValue(BarIndex())+2, DLI  +0.05, colorPaleGreen);
 }

//////////////////////////////////////////////////////////////////////////////////////////////////////////////////////////////////////////////

//Previous Days HI LO //

numbars = LastValue( Cum( Status( "barvisible" ) ) );
fraction = IIf( StrRight( Name(), 3 ) == "", 3.2, 3.2 );

DC = TimeFrameGetPrice( "C", inDaily); // close

DH = TimeFrameGetPrice( "H", inDaily );

DL = TimeFrameGetPrice( "L", inDaily );

PP = ( DL + DH + DC ) / 3;

PPI = LastValue ( PP, 1 );   // Pivot

DayH = TimeFrameGetPrice( "H", inDaily, -1 );

DayHI = LastValue ( DayH, 1 );// yesterdays high

DayL = TimeFrameGetPrice( "L", inDaily, -1 );

DayLI = LastValue ( DayL, 1 );	// yesterdays low

DayC = TimeFrameGetPrice( "C", inDaily, -1 );

DayCI = LastValue ( DayC, 1 );	// yesterdays close

DayO = TimeFrameGetPrice( "O", inDaily );			// current day open

DayH2 = TimeFrameGetPrice( "H", inDaily, -2 );

DayH2I = LastValue ( DayH2, 1 ); // Two days before high

DayL2 = TimeFrameGetPrice( "L", inDaily, -2 );

DayL2I = LastValue ( DayL2, 1 );  // Two days before low

DayH3 = TimeFrameGetPrice( "H", inDaily, -3 );

DayH3I = LastValue ( DayH3, 1 );  // Three days before high

DayL3 = TimeFrameGetPrice( "L", inDaily, -3 );

DayL3I = LastValue ( DayL3, 1 );  // Three days before low

numbars = LastValue( Cum( Status( "barvisible" ) ) );

hts  = -33.5;

YHL = ParamToggle( "Yesterday HI LO", "Hide|Show", 1 );

if ( YHL == 1 )
{

    //Plot( DayO, "DO", colorCustom12,  styleDots | styleNoLine | styleNoRescale  );
    //Plot( DayL, "YL", colorPaleTurquoise, styleDots | styleNoLine | styleNoRescale  );
    //Plot( DayH, "YH", colorOrange,        styleDots | styleNoLine | styleNoRescale  );

    PlotText( " Yes Day High =" + WriteVal( DayH, fraction ), 	LastValue( BarIndex() ) + 1, DayHI,  colorRose );
    PlotText( " Yes Day Low  =" + WriteVal( DayL, fraction ), 	LastValue( BarIndex() ) + 1, DayLI,  colorPaleTurquoise );
    PlotText( " Yes Day C    =" + WriteVal( DayL, fraction ), 	LastValue( BarIndex() ) + 4, DayCI, colorWhite );
}

TDBHL = ParamToggle( "2/3Days before HI LO", "Hide|Show", 1 );

if ( TDBHL == 1 )
{
    //Plot( DayL2, "2DBL", colorBrightGreen, styleDots | styleNoLine | styleNoRescale  );
    //Plot( DayH2, "2DBH", colorRed, styleDots | styleNoLine | styleNoRescale  );
    //Plot( DayL3, "3DBL", colorGreen, styleDots | styleNoLine | styleNoRescale  );
    //Plot( DayH3, "3DBH", colorViolet , styleDots | styleNoLine | styleNoRescale  );

    //PlotText( " 1DB Hi =" + WriteVal( DayH2, fraction ), 	LastValue( BarIndex() ) - 3, DayH2I, colorPink );
    //PlotText( " 1DB Lo =" + WriteVal( DayL2, fraction ), 	LastValue( BarIndex() ) - 3, DayL2I, colorBrightGreen );
    //PlotText( " 2DB Hi =" + WriteVal( DayH3, fraction ), 	LastValue( BarIndex() ) - 3, DayH3I, colorViolet );
    //PlotText( " 2DB Lo =" + WriteVal( DayL3, fraction ), 	LastValue( BarIndex() ) - 3, DayL3I, colorGreen );
}

//////////////////////////////////////////////////////////////////////////////////////////////////////////////////////////////////////////////

Title =

"\n" +

EncodeColor( colorBlack ) +  //Date() + "\n" + "\n" +
EncodeColor( colorWhite)      + "////Day O " + EncodeColor(colorWhite)  + O +
EncodeColor( colorViolet)     + "////Day H " + EncodeColor(colorViolet) + DHI +
EncodeColor( colorPaleGreen)  + "////Day L " + EncodeColor(colorPaleGreen)  + DLI +
EncodeColor( colorYellow)     + "////Day C " + EncodeColor(colorYellow) + C + "\n" + "\n" +
EncodeColor( colorWhite )     + "////Yes Day Close= " + EncodeColor( colorWhite )  + DayCI + "\n" + "\n" +
EncodeColor( colorViolet )    + "////2DB Hi= " + EncodeColor( colorViolet )  + DayH3I +
EncodeColor( colorPink   )    + "////1DB Hi= " + EncodeColor( colorPink    )  + DayH2I +
EncodeColor( colorRose   )    + "////Yes Day Hi= " + EncodeColor( colorRose)  + DayHI + "\n" + "\n" +
EncodeColor( colorGreen   )   + "////2DB Lo= " + EncodeColor( colorGreen  )   + DayL3I +
EncodeColor( colorBrightGreen   )+ "////1DB Lo= " + EncodeColor( colorBrightGreen  )  + DayL2I +
EncodeColor( colorPaleTurquoise )+ "////Yes Day Lo= " + EncodeColor( colorPaleTurquoise) + DayLI ;

//////////////////////////////////////////////////////////////////////////////////////////////////////////////////////////////////////////////

_SECTION_BEGIN( "Magnified Market Price" );
//by Vidyasagar, vkunisetty@yahoo.com//
FS = Param( "Font Size", 25, 11, 100, 1 );
GfxSelectFont( "Times New Roman", FS, 700, True );
GfxSetBkMode( colorWhite );
GfxSetTextColor( ParamColor( "Color", colorWhite ) );
Hor = Param( "Horizontal Position", 420, 1, 1200, 1 );
Ver = Param( "Vertical Position", 100, 1, 830, 1 );
GfxTextOut( "" + C, Hor , Ver );
GfxTextOut( Name(), Hor, Ver-50 );

GfxSetTextColor( ParamColor( "ColorY", colorWhite ) );
GfxTextOut( "" + V, Hor , Ver + 45 );

YC = TimeFrameGetPrice( "C", inDaily, -1 );
DD = Prec( C - YC, 2 );
xx = Prec( ( DD / YC ) * 100, 2 );
GfxSelectFont( "Times New Roman", 20, 700, True );
GfxSetBkMode( colorWhite );
GfxSetTextColor( ParamColor( "Color", colorRed ) );
GfxTextOut( "" + DD + " (" + xx + "%)", Hor , Ver + 90 );

_SECTION_END();

//////////////////////////////////////////////////////////////////////////////////////////////////////////////////////////////////////////////
8 comments
Leave Comment
Please login here to leave a comment.
Thanks you
Code looks really complicated however the results are pretty good. Thank you for sharing.
Hi Please let me know your contact details as i see there are some improvements that can be made to the code.
Its repainting ?
It is only Zig-Zag, nothing else.
I am in agree with rashedbgd, its nothing but 2 zigzag and not approach to a good indicator
I am in agreement with rashedbgd, its nothing but 2 zigzag and not approach to a good indicator
good result but zig zag is not to be trusted by back test