TTM Squeeze Wave A for Amibroker (AFL)
sachinlanke over 5 years ago Amibroker (AFL)
I have created a TTM Squeeze Wave A indicator for Amibroker with customizable parameters based on the code found on the web somewhere. This will be useful for your trading.
Screenshots
Indicator / Formula
Copy & Paste Friendly
_SECTION_BEGIN("TTM Squeeze Waves A_Sachin");
f1 = Param("Wave A1 Fast Avg", 8, 2, 200, 1 );
s1 = Param("Wave A1 Slow Avg", 34, 2, 200, 1 );
fastMA1= EMA(Close, f1);
slowMA1= EMA(Close, s1);
macd1 = fastMA1-slowMA1;
sig1 = EMA(macd1, s1);
hist1 = macd1-sig1;
f1_1 = Param("Wave A2_ Fast Avg", 8, 2, 200, 1 );
s1_1 = Param("Wave A2 Slow Avg", 55, 2, 200, 1 );
fastMA1_1= EMA(Close, f1_1);
slowMA1_1= EMA(Close, s1_1);
macd1_1 = fastMA1_1-slowMA1_1;
sig1_1 = EMA(macd1_1, s1_1);
hist1_1 = macd1_1-sig1_1;
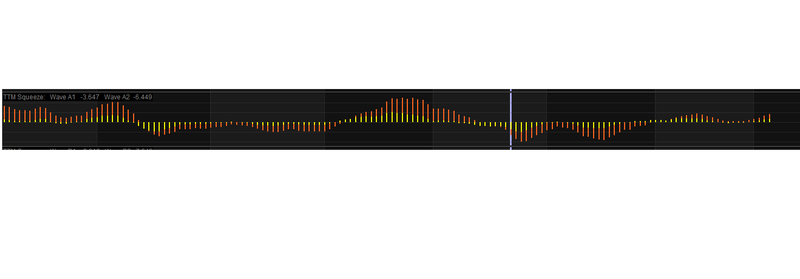
Plot(hist1, "Wave A1", colorYellow,styleHistogram | styleThick);
Plot(hist1_1, "Wave A2", colorOrange, styleHistogram | styleThick);
Title="TTM Squeeze: Wave A1 "+WriteVal(hist1)+" Wave A2"+WriteVal(hist1_1) ;
_SECTION_END();10 comments
Leave Comment
Please login here to leave a comment.
Can you detail how this works? I am aware of TTM Squeeze but the dual tone histogram seems new to me.
PLEASE EXPLAIN BUY SELL CONDITION
how to read this histogram? what is the meaning when the red candle reach the top?
This is MACD..Not TTM squeeze!
This is a 2 overlapped TTM indicator with low and high sensitivity, each of them must be considered separately -In general, this type of indicator has a delay to the price chart
This is a 2 overlapped TTM indicator with low and high sensitivity, each of them must be considered separately -In general, this type of indicator has a delay to the price chart
Thanks
What about B & C waves, can you share any idea how to make them?
Ref: https://www.tradingview.com/script/nYOzTA1Y-UCS-TTM-Wave-A-B-C/
Just use above AFL for the B & C averages & you will be done.
Usage: https://www.youtube.com/watch?v=n-f-aSOJLgc
Wave A is useful to identify how strong the market trend is as well as the trend direction. Wave A is constructed using MACD. B & C waves can also be created using the same code but with different time settings. Wave B is for medium term trend and Wave C is for longer term trend.
Buy Conditions are:-
1) When Wave A crosses UP “0” line from below (Conservative Entry) OR
2) When Wave A starts turning up from trough. (Aggressive Entry)
3) Sell when Wave A reaches Peak and starts turning down
Short Conditions are:-
1) When Wave A crosses DOWN “0” line from above (Conservative Entry) OR
2) When Wave A starts turning down from Peak. (Aggressive Entry)
3) Cover when Wave A reaches trough and starts turning up.
Hope this is useful friends.