Smooted Hiken-Ashi with Buy/Sell signal for Amibroker (AFL)
niladri about 5 years ago Amibroker (AFL)
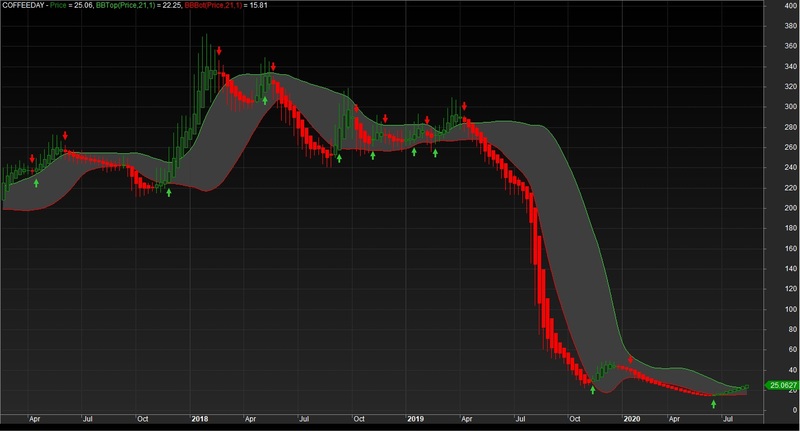
This DEMA smoothed Hiken-Ashi indicator helps traders to trade according to volatility confirmation & be on the side of the trend.
If the bars are below red volatility band ( std deviation of 1, with a valure of 21 ), then we Sell.
If the bars are above green volatility band ( std deviation of 1, with a valure of 21 ), then we Buy.
Buy/Sell signal uses 3 checks Hiken-Ashi, MACD, Stoch.
Note:
1. When the trend is up, focus on candle’s body. Whenever the body become smaller, it indicates weakening.
2. When the trend is down, focus on the candle’s shadow. Whenever the shadow become longer, it indicates 2 signal : continuation or reversal.
Screenshots
Indicator / Formula
Apply to main chart as "Insert linked"
//////////////////////////////////////////////////////////////////////////////////////////////////////////////////////////////////////////////////
//  Heiken Ashi is a good and powerful indicator.
//
//  Usage:
//
//  1. When the trend is up, focus on candle’s body. Whenever the body become smaller, it indicates weakening.
//
//  2. When the trend is down, focus on the candle’s shadow. Whenever the shadow become longer, it indicates 2 signal : continuation or reversal.
//
//  Combine it with your other favorit indicator to get the best result.
//
//  Hope this can be helpful.
//
//////////////////////////////////////////////////////////////////////////////////////////////////////////////////////////////////////////////////

_SECTION_BEGIN("Chart");
SetChartOptions(0,chartShowArrows|chartShowDates);
SetChartBkColor(ParamColor("Outer Panel",colorDarkGrey));
SetChartBkGradientFill(ParamColor("Upper Chart",colorCustom2),ParamColor("Lower Chart",colorDarkGrey));
GraphXSpace=Param("GraphXSpace",5,-10,25,1);
_SECTION_END();

_SECTION_BEGIN("Heikin-Ashi");

global MAType;
global MAName;

procedure MAList(type)
{
	chList = ParamList("Type", List = "1 - EMA, 2 - WMA, 3 - DEMA, 4 - WILDERS", type-1);
	for( i=0; i<5; i++)
	{
		if( StrExtract(List, i) == chList ) MAType = i+1;
	}
	MAName = WriteIf(MAType == 1,"EMA", WriteIf(MAType == 2,"WMA", WriteIf(MAType == 3,"DEMA", WriteIf(MAType == 4,"WILDERS",""))));
}

MAList(3);  //  Type of Moving Average to use in HA calculation ( Choose via Properties )

procedure MAFormula(array,per,type)
{
	CallFormula = IIf(type == 1, EMA(array,Per), IIf(type == 2, WMA(array,Per), IIf(type == 3,DEMA(array,Per), IIf(type == 4,Wilders(array,Per),Null))));
	return CallFormula;
}

per1=Param("MA1 period",6,1,10);
per2=Param("MA2 period",2,1,10);

mO=MAFormula(O,per1,MAType);
mH=MAFormula(H,per1,MAType);
mL=MAFormula(L,per1,MAType);
mC=MAFormula(C,per1,MAType);

HaClose1 = IIf(BarIndex()>0,(MO+MH+ML+MC)/4,Close);
HaOpen1 = IIf(BarIndex()>0,AMA( Ref( HaClose1, -1 ), 0.5 ),Open);

HaClose=EMA(HaClose1,per2);
HaOpen=EMA(HaOpen1,per2);

HaHigh = Max( mH, Max( HaClose, HaOpen ) );
HaLow = Min(mL, Min( HaClose, HaOpen ) );

barcolor = IIf(HaClose >= HaOpen,colorGreen,colorRed);

PlotOHLC(HaOpen,HaHigh,HaLow,HaClose,"Price", barcolor, styleCandle);

//HA Signal Generation

stochup= StochK()>StochD() ;
MACDup= MACD()>Signal() ;
Hist= MACD()-Signal() ;
Histup= Hist>Ref(Hist,-1) ;
HAup= HaClose>=HaOpen ;
BuyHa= HaClose>=HaOpen ;
SellHa= HaClose<HaOpen ;

myBuy = BuyHa AND macdup AND histup AND stochup ;
myShort = SellHa AND !histup AND !stochup ;

Buy = ExRem(mybuy,myshort);
Sell = ExRem(myshort,mybuy);

PlotShapes(IIf(Buy,shapeUpArrow,shapeNone),colorLime,0,haLow,Offset=-15);
PlotShapes(IIf(Sell,shapeDownArrow,shapeNone),colorRed,0,haHigh,Offset=-15);
_SECTION_END();

_SECTION_BEGIN("Bolinger Bands");
P = ParamField("Price field",-1);
Periods = Param("Periods", 21, 2, 100, 1 );
Width = Param("Width", 1, 0, 10, 0.05 );
Color = ParamColor("Color", colorLightGrey );
Color = ColorBlend( Color,  GetChartBkColor(), 0.5 );
Style = ParamStyle("Style", styleLine | styleNoLabel ) | styleNoRescale;;
Plot( bbt = BBandTop( P, Periods, Width ), "BBTop" + _PARAM_VALUES(), colorLime, Style );
Plot( bbb = BBandBot( P, Periods, Width ), "BBBot" + _PARAM_VALUES(), colorRed, Style );
PlotOHLC( bbt, bbt, bbb, bbb, "", ColorBlend( Color, GetChartBkColor(), 0.7 ), styleNoLabel | styleCloud | styleNoRescale, Null, Null, Null, -1 );
_SECTION_END();
4 comments
Leave Comment
Please login here to leave a comment.
hi
i am getting below error
Error 702. Missing short/cover variable assignments.
The formula that you are trying to backtest does not contain proper Short and Cover rules. Short and Short rules should be written as assignments as shown below:
Short = Cross( MA, Close ) );
Cover = Cross( Close, MA );
If you do not want to test the short side, please go to the Settings and select Long from Positions combo-box. This will allow you to test long side only.
For more details see Tutorial: Backtesting your trading ideas
When I ran this strategy it seemed to buy at the low of the day. That may be a bit difficult to obtain with end of day data. Perhaps a one day delay to buy at the open would be practical. Thanks for the beautiful effort. RBuck
Hi Niladri,
This is a wonderful indicator you have created. I have been observing its performance since one week. It seems to work. Could please guide me on how to remove the repainting signals. Also, I have another query and would like to contact you. Can I get in touch? 8971185615
Hi Niladri ,
i’m using ami5.60 and unable to see anything after adding indicator , have i missed a step or anything.Thanks