[Indicator] Plot Area Moving Averages for Amibroker (AFL)
aLdyputRa almost 5 years ago Amibroker (AFL)
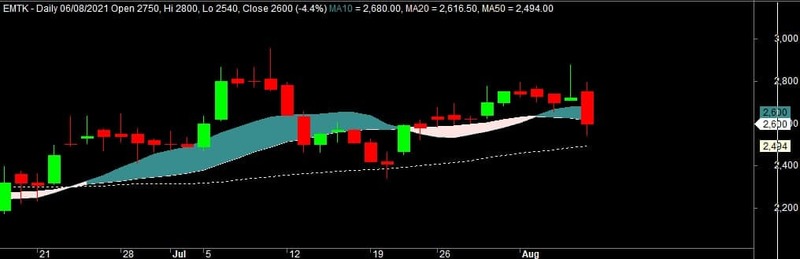
This indicator is used as a buy and sell area on a stock.
If the price crosses the pink layer, you can take a buy position. If you touch the teal layer, you can sell it first.
Please use wisely as needed. Any question? Please contact me on the telegram group @CelotehSaham.
Thank you
Screenshots
Indicator / Formula
Copy & Paste Friendly
Apply to price chart
GraphXSpace = 20;

PlotOHLC( Open,MA(Close, 20),MA (Close, 10), Close, "", IIf( MA(Close, 10) > MA(Close, 20), colorTeal , colorRose), styleCloud | styleClipMinMax);

Plot (MA(Close, 10), "MA10", colorTeal, styleThick|styleNoLabel);
Plot (MA(Close, 20), "MA20", colorRose, styleThick|styleNoLabel);
Plot (MA(Close, 50), "MA50", colorLightYellow, styleDashed);
0 comments
Leave Comment
Please login here to leave a comment.