Stock Portfolio Organizer
The ultimate porfolio management solution.
Shares, Margin, CFD's, Futures and Forex
EOD and Realtime
Dividends and Trust Distributions
And Much More ....
WiseTrader Toolbox
#1 Selling Amibroker Plugin featuring:
Advanced Adaptive Indicators
Advanced Pattern Exploration
Neural Networks
And Much More ....
RSI with SL (For Intraday & Positional) for Amibroker (AFL)
Rating:
3 / 5 (Votes 3)
Tags:
rsi, amibroker, oscillator, trading system
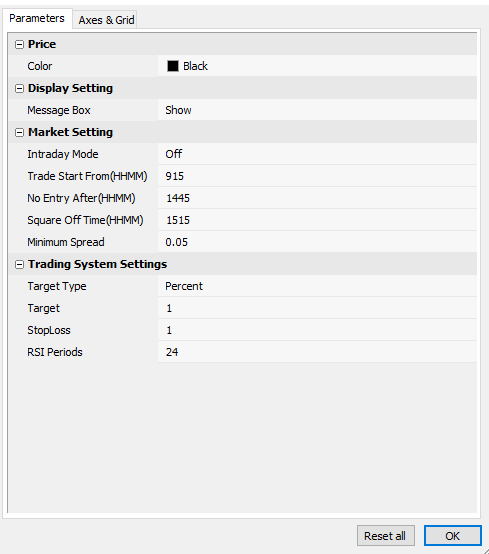
AFL using RSI Strategy for Intraday & Positional Trades
You can set-up
*Trade Time
*Choose Intraday & Positional trades
*Minimum Spread
*Target can be selected in percent or points
*RSI periods can be modified.
(Pls backtest prior use)
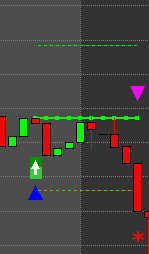
Screenshots
Indicator / Formula
Copy & Paste Friendly
SetChartOptions( 0, chartShowDates );

_SECTION_BEGIN( "Price" );

_N(Title = StrFormat("{{NAME}} - {{INTERVAL}} {{DATE}} Open %g, Hi %g, Lo %g, Close %g (%.1f%%) {{VALUES}}", O, H, L, C, SelectedValue( ROC( C, 1 ) ) ));

Plot( C, "Close", ParamColor( "Color", colorBlack ), styleNoTitle | styleCandle  | styleThick );


SetBarsRequired( sbrAll, sbrAll );

_SECTION_END();


_SECTION_BEGIN( "Display Setting" );

MessageBox = ParamToggle( "Message Box", "Hide|Show", 1 );

_SECTION_END();

_SECTION_BEGIN( "Market Setting" );

IM = ParamToggle( "Intraday Mode", "Off|On", 1 );
TradeStartTime = Param( "Trade Start From(HHMM)", 915, 600, 2400, 1 );
NoEntryTime = Param( "No Entry After(HHMM)", 1445, 900, 2400, 1 );
ExitTime = Param( "Square Off Time(HHMM)", 1515, 900, 2400, 1 );
MinSpread = Param("Minimum Spread", 0.05, 0.001, 10, 0.001);

_SECTION_END();


_SECTION_BEGIN("Trading System Settings");
PORP = ParamToggle("Target Type", "Percent|Point", 0);
TG = Param("Target", 1, 0.05, 100, 0.05);
Stop = Param("StopLoss", 1, 0.05, 100, 0.05);
RSIperiods = Param( "RSI Periods", 15, 1, 200, 1 );
_SECTION_END();
//////////////////////////////////////////////////////////////

FC = DateNum() != Ref( DateNum(), -1 );
LC = DateNum() != Ref( DateNum(), 1 );
EntryTime = IIf(IM, TimeNum()>=TradeStartTime*100 AND TimeNum()<NoEntryTime*100, 1);
MarketClose = IIf(IM, ExRem(TimeNum()>=ExitTime*100, LC), 0);
/////////////////////////////////////////////////////////////

_SECTION_BEGIN( "RSI setting" );
//price = ParamToggle( "Plot Price", "Off|On", 1 );

RSI_line = RSI( RSIperiods);

pBuy = Cross(RSI_line,30) ;
PShort = Cross(70,RSI_line) ;
Buy = Ref(pBuy,-1)  AND EntryTime ;
Short = Ref(PShort,-1)  AND EntryTime ;
Sell = Short OR MarketClose;
Cover =  Buy OR MarketClose;
Buy = ExRem(Buy, Sell);
Short = ExRem(Short, Cover);


OpenLong = Flip(Buy, Sell);
OpenShort = Flip(Short, Cover);


BuyPrice = ValueWhen(Buy, O);
ShortPrice = ValueWhen(Short, O);


if(PORP)
{
	BTP1=BuyPrice+TG;
	STP1=ShortPrice-TG;
}
else
{
	BTP1=(round(BuyPrice*(1+TG/100)/MinSpread)*MinSpread);
	STP1=(round(ShortPrice*(1-TG/100)/MinSpread)*MinSpread);
}

BTPrice1 = IIf(OpenLong ,BTP1, Null);
STPrice1 = IIf(OpenShort ,STP1, Null);


if(PORP)
{
	BuySL = BuyPrice - Stop;
	ShortSL = ShortPrice + Stop;

}
else
{
	BuySL = (round(BuyPrice*(1-Stop/100)/MinSpread)*MinSpread);
	ShortSL = (round(ShortPrice*(1+Stop/100)/MinSpread)*MinSpread);
}


BSLPrice = IIf( OpenLong OR Sell, BuySL, Null );
SSLPrice = IIf( OpenShort OR Cover, ShortSL, Null );
////////////////////////////////////////////////////////////

TSell1 = (H>=BTPrice1) AND !Buy AND !IsNull(BTPrice1);
SLSell = (L<=BSLPrice AND !Buy) AND !IsNull(BSLPrice);

TCover1 = (L<=STPrice1) AND !Short AND !IsNull(STPrice1);
SLCover = (H>=SSLPrice AND !Short) AND !IsNull(SSLPrice);

Sell = (Sell OR TSell1) OR SLSell OR MarketClose;
Cover = (Cover OR TCover1) OR SLCover OR MarketClose;


Buy = ExRem(Buy, Sell);
Short = ExRem(Short, Cover);
Sell = ExRem(Sell, Buy);
Cover = ExRem(Cover, Short);


OpenLong = Flip(Buy, Sell);
OpenShort = Flip(Short, Cover);

TSell1 = (OpenLong OR Sell) AND TSell1;
TCover1 = (OpenShort OR Cover) AND TCover1;
SLSell = (OpenLong OR Sell) AND SLSell;
SLCover = (OpenShort OR Cover) AND SLCover;

TSell1 = ExRem(TSell1, Sell);
SLSell = ExRem(SLSell, Sell);

TCover1 = ExRem(TCover1, Cover);
SLCover = ExRem(SLCover, Cover);

BuyPrice = IIf(OpenLong OR Sell, BuyPrice, Null);
ShortPrice = IIf(OpenShort OR Cover, ShortPrice, Null);
BTPrice1 = IIf(OpenLong OR Sell,BTPrice1, Null);
STPrice1 = IIf(OpenShort OR Cover,STPrice1, Null);
BSLPrice = IIf(OpenLong OR Sell, BSLPrice, Null);
SSLPrice = IIf(OpenShort OR Cover, SSLPrice, Null);
///////////////////////////////////////////////////////////////////////////////////////////
SellPrice = IIf(Sell*SLSell, BSLPrice, IIf(Sell*TSell1, BTPrice1,IIf(Sell*Short,ShortPrice,  IIf(Sell*MarketClose, Close ,IIf (Sell,Close,Null)))));
CoverPrice = IIf(Cover*SLCover, SSLPrice,IIf(Cover*TCover1,STPrice1 ,IIf(Cover*Buy,BuyPrice, IIf(Cover*MarketClose, Close,IIf(Cover,Close,Null)))));

/////////////////////////////////////////////////////////////////////////////////
/////////////////////////////////////////////////////////////////////////////////


Plot(BuyPrice, "Buy Price", colorBrightGreen, styleLine|styleDots|styleThick|styleNoLabel|styleNoRescale|styleNoTitle);
Plot(ShortPrice, "Short Price", colorRed, styleLine|styleDots|styleThick|styleNoLabel|styleNoRescale|styleNoTitle);
Plot(BTPrice1, "Buy Target Price1", colorGreen, styleLine|styleDashed|styleNoTitle|styleNoRescale);
Plot(STPrice1, "Short Target Price1", colorRed, styleLine|styleDashed|styleNoTitle|styleNoRescale);
Plot(BSLPrice, "Buy SL Price", colorRed, styleLine|styleDashed|styleNoTitle|styleNoRescale);
Plot(SSLPrice, "Short SL Price",colorGreen , styleLine|styleDashed|styleNoTitle|styleNoRescale);


PlotShapes(IIf(Buy, shapeSquare, shapeNone),colorGreen, 0,L, Offset=-40);
PlotShapes(IIf(Buy, shapeSquare, shapeNone),colorLime, 0,L, Offset=-50);
PlotShapes(IIf(Buy, shapeUpArrow, shapeNone),colorWhite, 0,L, Offset=-45);
PlotShapes(IIf(Short, shapeSquare, shapeNone),colorRed, 0, H, Offset=40);
PlotShapes(IIf(Short, shapeSquare, shapeNone),colorOrange, 0,H, Offset=50);
PlotShapes(IIf(Short, shapeDownArrow, shapeNone),colorWhite, 0,H, Offset=-45);
PlotShapes(IIf(Cover, shapeUpTriangle, shapeNone),colorCustom7, 0,L, Offset=-70);
PlotShapes(IIf(Sell, shapeDownTriangle, shapeNone),colorCustom12, 0,H, Offset=-70);
PlotShapes( TSell1 * shapeStar, colorBrightGreen , 0, H, 25, 0 );
PlotShapes( SLCover * shapeStar, colorBrightGreen , 0, H, 25, 0 );
PlotShapes( SLSell * shapeStar, colorRed , 0, L, -25, 0 );
/////////////////////////////////////////////////////////////////////////////////////////////////////
1 comments
Leave Comment
Please login here to leave a comment.
Back
Which timeframe you saw profits ? I checked for intraday 5/10/15 mins seeing losses
pls explain