Pivot Fibonacci Visualization for Indonesia Stock Market for Amibroker (AFL)
adyarsoso almost 5 years ago Amibroker (AFL)
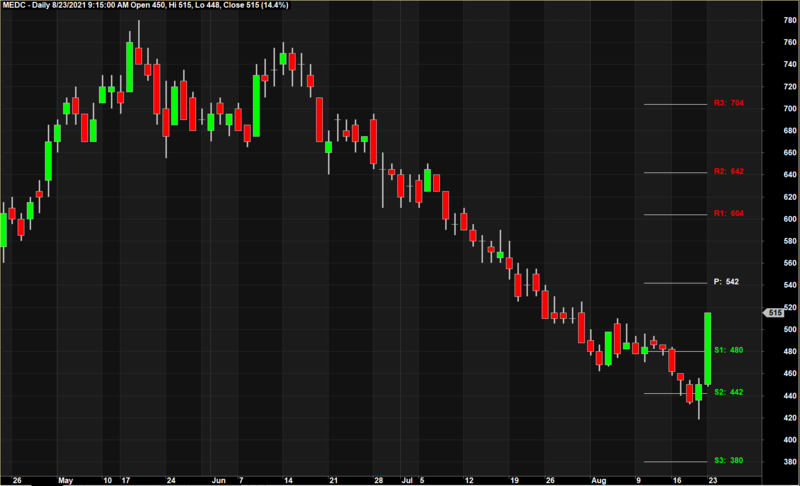
Pivot Fibo indicator is used as an improvement of classic Price Pivot Point indicator. The problems with classic pivot point are as follows:
- The formula is based on daily candles, hence making it a narrow spread of points. If today’s candle is narrow (short)the points will also be close to each other.
- The formula based on daily candles, hence it will constantly change every day as new candle will form. What is taken as R1 today may become Pivot or S1 tomorrow.
By combining Pivot with Fibonacci, one could get more advantages as follows:
- Fix spread points, because the formula is based on Swing Low and Swing High. As long as the price do not breaking last Swing Low (taken as support) and last Swing High (taken as last Resistance), the spread will stay the same.
- Since Pivot Fibo used Swing Low and Swing High rather than Candle body, it will give wider range of pivot points spread.
In this formula given below, I have fixed the period so one can instantly be using without the need to select the bar. Finally, I add some text next to every fibo line to make it easier to read.
As you may notice, Pivot Fibo point is often concurrent with EMA lines making it a good Support Resistance reference.
The Fibo level used are 38.2%, 61.8%, 100% and 138.2% (optional).
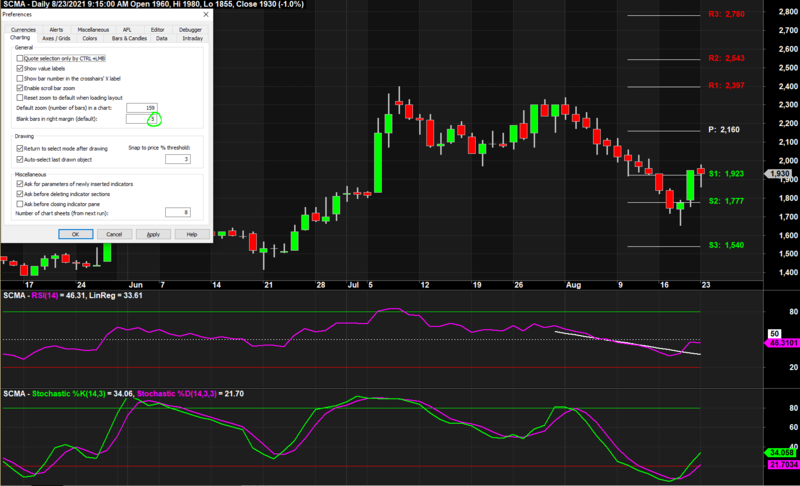
Recommended setting: set 5 blank bars in your Amibroker setting (Tools > Preferences). Ctrl + scroll down to zoom in the chart until all text is conveniently visible.
Screenshots
Indicator / Formula
Apply to price chart
_SECTION_BEGIN("PIVOT FIBONACCI");{

ShowFibHiProbZone=ParamToggle("Show FIb High-Probability Zone","No|Yes",1);
HpzColor = ParamColor("Line Color",colorWhite);
Periodicity = inDaily;

if(ShowFibHiProbZone AND Interval()<inHourly)
{
Periodicity = inDaily;
}
else if(ShowFibHiProbZone AND Interval()==inHourly)
{
Periodicity = inWeekly;
}
else if (ShowFibHiProbZone AND Interval()>=inDaily AND Interval()<inMonthly)
{
Periodicity = inMonthly;
}
else if(ShowFibHiProbZone AND Interval()>inWeekly AND Interval()<inYearly)
{
Periodicity = inYearly;
}
else

Hi=Ref(H,-1);
Lo=Ref(L,-1);
Cl=Ref(C,-1);


bi = BarIndex();
lvbi = LastValue(bi);
fb = EndValue(bi);

Hi=LastValue(TimeFrameGetPrice("H",Periodicity,-1));
Lo=LastValue(TimeFrameGetPrice("L",Periodicity ,-1));
Cl=LastValue(TimeFrameGetPrice("C",Periodicity ,-1));

p=round((Hi+Lo+Cl)/3);

as1b=round(p-((Hi-Lo)*0.382));
as2b=round(p-((Hi-Lo)*0.618));
as3b=round(p-((Hi-Lo)*1.000));
as4b=round(p-((Hi-Lo)*1.382));

ar1b=round(((Hi-Lo)*0.382)+p);
ar2b=round(((Hi-Lo)*0.618)+p);
ar3b=round(((Hi-Lo)*1.000)+p);
ar4b=round(((Hi-Lo)*1.382)+p);

as1bl = LineArray((fb-7), as1b, fb, as1b, 0);
as2bl = LineArray((fb-7), as2b, fb, as2b, 0);
as3bl = LineArray((fb-7), as3b, fb, as3b, 0);
as4bl = LineArray((fb-7), as4b, fb, as4b, 0);
pl 	  = LineArray((fb-7), p, fb, p, 0);
ar1bl = LineArray((fb-7), ar1b, fb, ar1b, 0);
ar2bl = LineArray((fb-7), ar2b, fb, ar2b, 0);
ar3bl = LineArray((fb-7), ar3b, fb, ar3b, 0);
ar4bl = LineArray((fb-7), ar4b, fb, ar4b, 0);

extnd=0;
sty=styleNoLabel|styleStaircase|styleDashed|styleNoRescale;
Plot(ar1bl,"",colorWhite,styleNoLabel);
Plot(ar2bl,"",colorWhite,styleNoLabel);
Plot(ar3bl,"",colorWhite,styleNoLabel);
//Plot(ar4bl,"",colorwhite); comment out for fourth level

Plot(pl,"",colorWhite,styleNoLabel);
Plot(as1bl,"",colorWhite,styleNoLabel);
Plot(as2bl,"",colorWhite,styleNoLabel);
Plot(as3bl,"",colorWhite,styleNoLabel);
//Plot(as4bl,"",colorwhite); comment out for fourth level

PlotText("S1:  " + WriteVal(as1b, 1.0 ), BarCount, SelectedValue(as1b), colorBrightGreen, colorDefault, -3);
PlotText("S2:  " + WriteVal(as2b, 1.0 ), BarCount, SelectedValue(as2b), colorBrightGreen, colorDefault, -3);
PlotText("S3:  " + WriteVal(as3b, 1.0 ), BarCount, SelectedValue(as3b), colorBrightGreen, colorDefault, -3);
PlotText("P:  " + WriteVal(p, 1.0 ), BarCount, SelectedValue(p), colorWhite, colorDefault, -3);
PlotText("R1:  " + WriteVal(ar1b, 1.0 ), BarCount, SelectedValue(ar1b), colorRed, colorDefault, -3);
PlotText("R2:  " + WriteVal(ar2b, 1.0 ), BarCount, SelectedValue(ar2b), colorRed, colorDefault, -3);
PlotText("R3:  " + WriteVal(ar3b, 1.0 ), BarCount, SelectedValue(ar3b), colorRed, colorDefault, -3);

_SECTION_END();}
1 comments
Leave Comment
Please login here to leave a comment.
It seems that the formula references FUTURE quotes.
If you backtest this system you may receive outstanding results
that CAN NOT be reproduced in real trading.