Balance of Power Indicator for Amibroker (AFL)
sergiomaxi over 4 years ago Amibroker (AFL)
Balance of Power (BOP) is an oscillator that measures the strength of buying and selling pressure. Introduced by Igor Levshin in the August 2001 issue of Technical Analysis of Stocks & Commodities magazine, this indicator compares the power of buyers to push prices to higher extremes with the power of sellers to move prices to lower extremes. When the indicator is in positive territory, the bulls are in charge; and sellers dominate when the indicator is negative. A reading near the zero line indicates a balance between the two and can mean a trend reversal.
https://school.stockcharts.com/doku.php?id=technical_indicators:balance_of_power
Screenshots
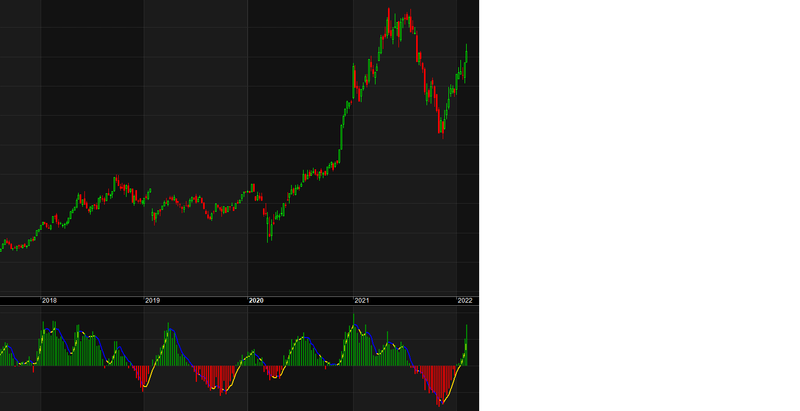
Indicator / Formula
BOP = (Close - Open) / (High - Low);
parameter = Param("BOP MA",14,2,30);
BOP = MA(bop,parameter);

mabop = MA(bop,4);
colorbop = IIf(bop > 0, colorGreen, colorred);

Plot( BOP, "", colorbop, styleHistogram | styleThick | styleNoLabel, maskHistogram );
Plot(mabop,"MA BOP", IIf(bop>mabop,colorGold,colorBlue), stylethick);
0 comments
Leave Comment
Please login here to leave a comment.