LLV-LLV Scalper. for Amibroker (AFL)
tgbssk over 4 years ago Amibroker (AFL)
Calculated with Previous (high + Previous low)/2
So it is like Running Pivot but not Pivot
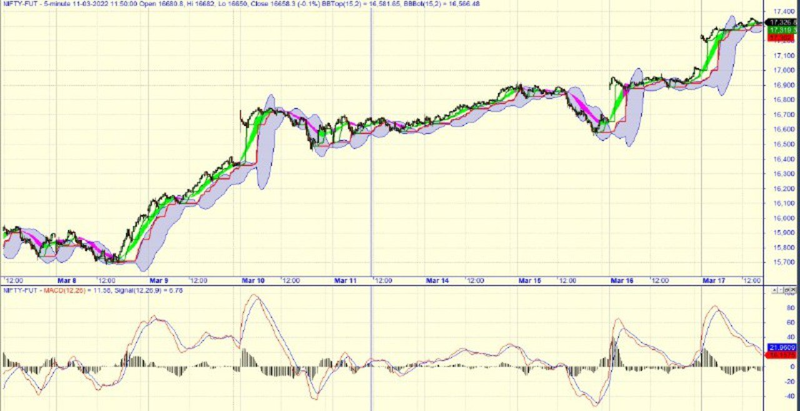
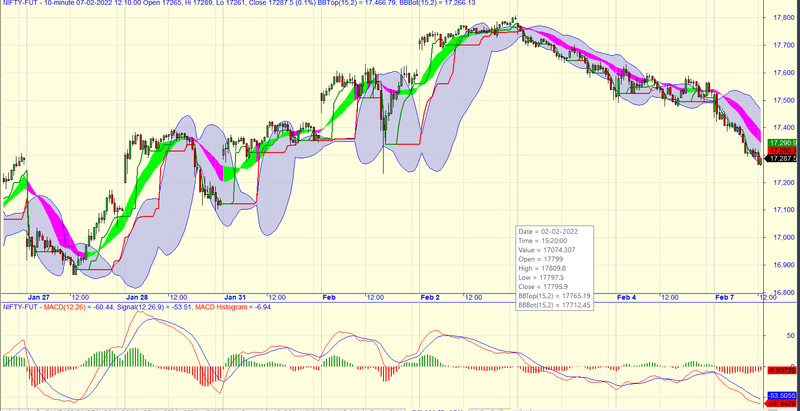
1) During Up Trend 2 Scalper Lines green and red will scatter and green move above band, Similarly average ribbon also moves above the band and turns bright green.
2) 1) During Down Trend 2 Scalper Lines green and red come together moves above band Similarly average ribbon comes inside band turns Pink.
3) When used with MACD the picture is more clear.
4) Average ribbon is in toggle mode.
Screenshots
Indicator / Formula
Copy & Paste Friendly
USE with MACD
/* ---------------------------------------------
HHV-LLV-Scalper by Abhimanyu Y. Altekar  V 1.2  on 17th March 2022
Email abhimanyu.altekar@gmail.com
----------------------------------------------- */
SetChartOptions(0,chartShowArrows|chartShowDates);
_N(Title = StrFormat("{{NAME}} - {{INTERVAL}} {{DATE}} Open %g, Hi %g, Lo %g, Close %g (%.1f%%) {{VALUES}}", O, H, L, C, SelectedValue( ROC( C, 1 ) ) ));
Plot( C, "Close", ParamColor("Color", colorBlack ), styleNoTitle | ParamStyle("Style") | GetPriceStyle() );

isavg = ParamToggle("Show Averages","No|Yes",1);
if(isavg ==1)
{
E14=MA(C,14);
E21=MA(C,21);
PlotOHLC(e14,e21,e14,e21,"",IIf(C>e14 AND C >e21,colorbrightGreen,colorCustom12 ),styleCloud|styleNoLabel|styleNoTitle,0,0,0,-1);
}
//
Plot(xFast= llV(Ref((H+L)/2,-1),5),"",colorgreen,styleThick);
Plot( xSlow=LLV (Ref((H+L)/2,-1),14),"",colorred,styleThick);

_SECTION_BEGIN("VWAP");


_SECTION_BEGIN("Bollinger Bands");
P =  //ParamField("Price field",-1);
Periods = Param("Periods", 15, 2, 100, 1 );
Width = Param("Width", 2, 0, 10, 0.05 );
Color = ParamColor("Color", colorblue );
Style = ParamStyle("Style", styleLine | styleNoLabel ) | styleNoLabel;
Plot( bbt = BBandTop( xSlow, Periods, Width ), "BBTop" + _PARAM_VALUES(), Color, Style );
Plot( bbb = BBandBot( xSlow, Periods, Width ), "BBBot" + _PARAM_VALUES(), Color, Style );
PlotOHLC( bbt, bbt, bbb, bbb, "", ColorBlend( Color, GetChartBkColor(), 0.8 ), styleNoLabel | styleCloud | styleNoRescale, Null, Null, Null, -1 );
_SECTION_END();

_SECTION_END();
0 comments
Leave Comment
Please login here to leave a comment.