Alligator BANDS for Amibroker (AFL)
tgbssk over 4 years ago Amibroker (AFL)
Since 2007 I have tried many Logics/system/Codes on Amibroker, I have also developed few.
Finally Concluded that, Original Basic Indicators are still powerful and We just need new approach and view to use them.
.
Bill William who developed Alligator System and Indicator called William’s R, said that, 70 of market time has no Trend. It means only 30% Time of market is good to trade.
Most of the Time traders loose money because market is flat and there is no trend so Frequent stop loss situation arises.
There are 3 basic Needs to trade.
.
1) Identify if there is any Trend
.
2) What type of Trend is Currently going ? Up, Down or no Trend ?
;
3) Strength of Trend
.
Alligator System added with Bollinger Band can identify Time to Enter and Exit when there is any trend. It is for all time frames as per need and choice.
MACD is Must it is Grand Father of all indicators.
-————————
How System Works
-————————
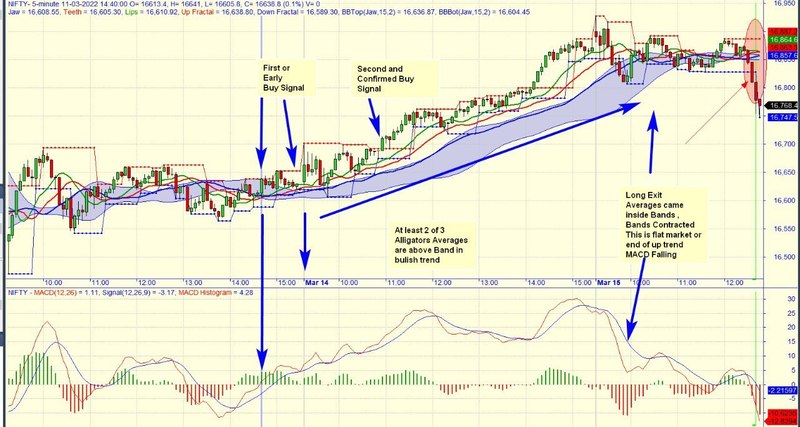
1) During Up trend at least 2 out of 3 averages of Alligator will move above BAND
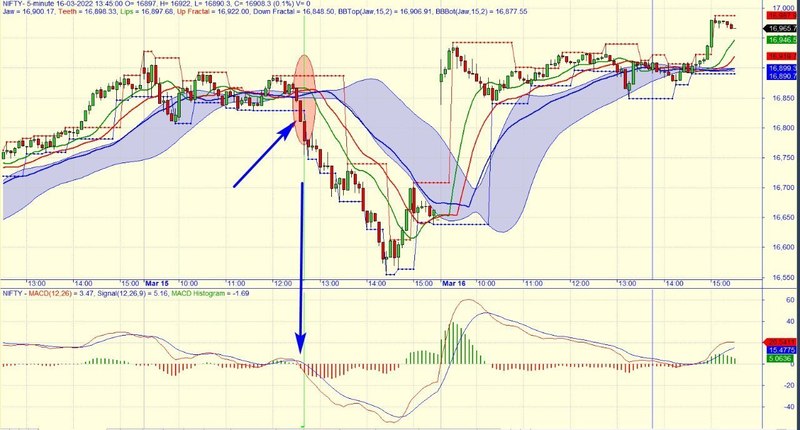
2) When Down Trend starts a big red Candle will fall below lower fractal and below the band, when down trend is strong 3 Alligator Averages will also fall below the band.
.
I have given couple of charts images to get idea.
.
Screenshots

Indicator / Formula
Works good with MACD
/*
   Bill William's Alligator System II
   Reference Website:
==================
   http://www.alpari-idc.com/en/market-analysis-guide/chaos-theory/alligator-and-gator.html
==================
   Modified from http://www.amibroker.com/library/detail.php?id=100, by Steve Wiser - slwiserr@erols.com
   Modified by TohMz  on June 9th, 2008
--------------------------------------------------------------------------------------------------------------------------------------
Added  JAW BAND's  break out logic by Abhimanyu Y. Altekar abhimanyu.altekar@gmail.com 15th
March 2022
-------------------------------------------------------
How Alligator  System Works with BANDS
-------------------------------------------------------

1) During Up trend at least 2 out of 3 averages of Alligator will move above BAND
.
2) When Down Trend starts a big red Candle will fall below lower fractal and below the band, when down trend is strong 3 Alligator Averages will also fall below the band.
.
I have given couple of charts images to get idea.

*/


SetChartOptions( 0, chartShowArrows|chartShowDates );

_SECTION_BEGIN("Price Chart");
_N(Title = StrFormat("{{NAME}}- {{INTERVAL}} {{DATE}} O= %g, H= %g, L= %g, C= %g (%.1f%%) V= " +WriteVal( V, 1.0 ) +"\n{{VALUES}}", O, H, L, C, SelectedValue( ROC( C, 1 )) ));
PriceStyle = GetPriceStyle();
PriceStyleOpt = ParamStyle("Price Style")|PriceStyle;

if (PriceStyle==styleCandle)
   Plot( C, "", colorBlack,  PriceStyleOpt);
else
   Plot( C, "", IIf( Close >= Ref(C, -1), colorBlue, colorRed ), PriceStyleOpt);
_SECTION_END();

_SECTION_BEGIN("BW Alligator");
/*** The trend indicators ***/

P= ParamList("Price", "Close|(H+L)/2|(H+C+L)/3",1);

if (P=="Close")
   A = C;

else
if (P=="(H+C+L)/3")
   A = (H+C+L)/3;
else
  A = (H+L)/2;

AlligatorJaw   = Ref(Wilders(A,13),-8);
AlligatorTeeth = Ref(Wilders(A,8), -5);
AlligatorLips  = Ref(Wilders(A,5), -3);

Plot(AlligatorJaw,  "Jaw", ParamColor("Jaw's Color",colorBlue), ParamStyle("Jaw's Style", styleThick));
Plot(AlligatorTeeth,"Teeth", ParamColor("Teeth's Color",colorRed), ParamStyle("Teeth's Style", styleThick));
Plot(AlligatorLips, "Lips", ParamColor("Lips's Color",colorGreen), ParamStyle("Lips's Style", styleThick));

_SECTION_END();


_SECTION_BEGIN("BW Fractal");

UpFractal= ValueWhen(
  (Ref(H,-2) > Ref(H, -4)) AND
  (Ref(H,-2) > Ref(H, -3)) AND
  (Ref(H,-2) > Ref(H, -1)) AND
  (Ref(H,-2) > H), Ref(H,-2));

DownFractal= ValueWhen(
  (Ref(L,-2) <= Ref(L, -4)) AND
  (Ref(L,-2) <=  Ref(L, -3)) AND
  (Ref(L,-2) <=  Ref(L, -1)) AND
  (Ref(L,-2) <=  L), Ref(L,-2));


//== Added Crash  crashandburn59 [at] hotmail.com solution
Plot(Ref(UpFractal,2), "Up Fractal", ParamColor("Up Fractal Color",colorRed), ParamStyle("Up Fractal Style", styleDots));
Plot(Ref(DownFractal,2), "Down Fractal",ParamColor("Down Fractal Color",colorBlue), ParamStyle("Down Fractal Style", styleDots));

//Plot(Max(HHV(H,3),Ref(UpFractal,2)), "Up Fractal", ParamColor("Up Fractal Color",colorRed), ParamStyle("Up Fractal Style", styleDashed));
//Plot(Max(HHV(H,3),Ref(UpFractal,2)), "Down Fractal",ParamColor("Down Fractal Color",colorBlue), ParamStyle("Down Fractal Style", styleDashed));

_SECTION_END();


_SECTION_BEGIN("Exploration");

/*
   Buy:  Scan stocks only breakout..maxbreakout (1~30%, default) and Trend is bullish
   Sell: Scan stocks only breakout..maxbreakout (1~30%, default) and Trend is bearish

*/
//== Price Increment Value - depend on different country
Inc = 0.1;


//== Set the Price Range for stock to scan
PriceFrom = Param("Price From:", 5,   0.1, 200, Inc);
PriceTo   = Param("Price To:",   100, 0.1, 200, Inc);
MaxBreakOut = Param("Max Breakout (%)", 5, 1, 30);
MaxBreakOut = MaxBreakOut/100;

Buy  = C>UpFractal AND C<=(1+MaxBreakOut)*UpFractal AND AlligatorTeeth>AlligatorJaw;
Sell = C<DownFractal AND C>=(1-MaxBreakOut)*DownFractal AND AlligatorTeeth<AlligatorJaw;


Filter = (Buy OR Sell) AND (C>=PriceFrom AND C<=PriceTo) AND V>0;


AddTextColumn(FullName(), "Security", 1.0, colorDefault, colorDefault, 200);
AddTextColumn( WriteIf(Buy,"Buy", WriteIf(Sell, "Sell", "")), "Trade", 1.0);
AddColumn( UpFractal, "Up Fratal");
AddColumn( DownFractal, "Down Fratal");
//AddColumn( MA(V,3)/EMA(V,17), "MAV(3/17)");
AddColumn( C, "Today's Close");


_SECTION_END();

_SECTION_BEGIN("Bollinger Bands");
P = ParamField("Price field",-1);
Periods = Param("Periods", 15, 2, 100, 1 );
Width = Param("Width", 2, 0, 10, 0.05 );
Color = ParamColor("Color", colorblue);
Style = ParamStyle("Style", styleLine | styleNoLabel ) | styleNoLabel;
Plot( bbt = BBandTop( AlligatorJaw , Periods, Width ), "BBTop" + _PARAM_VALUES(), Color, Style );
Plot( bbb = BBandBot( AlligatorJaw , Periods, Width ), "BBBot" + _PARAM_VALUES(), Color, Style );
PlotOHLC( bbt, bbt, bbb, bbb, "", ColorBlend( Color, GetChartBkColor(), 0.8 ), styleNoLabel | styleCloud | styleNoRescale, Null, Null, Null, -1 );
_SECTION_END();
3 comments
Leave Comment
Please login here to leave a comment.
nice set up
please describe about where to put stop loss
@Pankit
Stop loss is choice of individual it is not suggested by this logic.
But in case of short/sell upper fractal from Sell candle and in case of buy/cover
lower fractal from buy candle can be stop loss.
Avoid Gap up and Gap Down while taking fresh positions.
IT IS VERY DISAPPOINTING TO SEE THAT THERE IS NO HALF TREND CODE IN AMIBROKER. HALFTREND is available in mt4 and tradingview and zerodha.
Can somebody code half trend in afl please?
halftrend uses amplitude and standard deviation.