Behgozin Gap Finder for Amibroker (AFL)
hotaro3 over 3 years ago Amibroker (AFL)
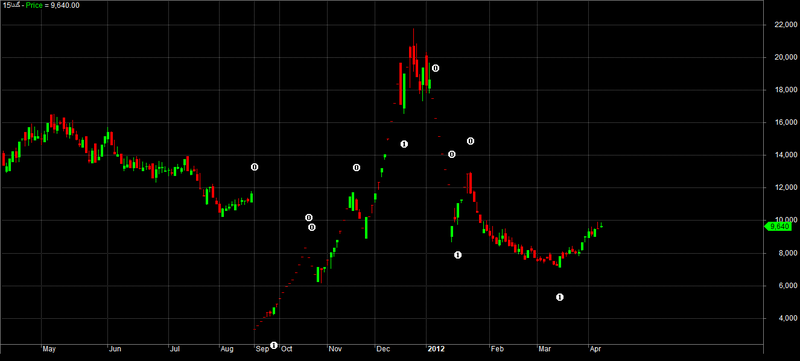
This indicator can show any gap in the chart by zero and 1 circle mark in any time frame. The gap tolerance is adjustable by yourself
Screenshots
Indicator / Formula
Copy & Paste Friendly
This indicator can show any gap in the chart in any time frame. The gap tolerance is adjustable by yourself
_SECTION_BEGIN("Price");
GraphXSpace = 5;
SetChartOptions(0, chartShowDates);
SetBarFillColor(IIf(C>O,ParamColor("Candle Up Color", colorBrightGreen),IIf(C<=O,ParamColor("Candle Down Color", colorRed),colorLightGrey)));
Plot(C,"Price",IIf(C>O,ParamColor("Shadow Up Color", ColorRGB(0,255,0)),IIf(C<=O,ParamColor("Shadow Color", ColorRGB(255,0,0)),colorLightGrey)),64,0,0,0,0,1);

_SECTION_END();

_SECTION_BEGIN("Behgozin Gap Finder");

Darsad=Param("Darsad",3.5,0.1,90,0.1);
HACLOSE=(O+H+L+C)/4;
HaOpen = AMA( Ref( HaClose,  -1 ),  1.0 );
HaHigh = Max( H,  Max( HaClose,  HaOpen ) );
HaLow = Min( L,  Min( HaClose,  HaOpen ) );

Buy =   C>(1+(Darsad/100))*Ref(C,-1);
Sell = Ref(C,-1)>(1+(Darsad/100))*C ;
SellA =   C<(1+(Darsad/100))*Ref(C,-1) AND L<Ref(L,-1);
BuyA =    Ref(C,-1)<(1+(Darsad/100))*C AND H>Ref(H,-1);

   PlotShapes( IIf( Buy, shapeDigit1, shapeNone), colorWhite , layer = 0,yposition = HaLow, offset = -50);
 PlotShapes( IIf( Sell, shapeDigit0, shapeNone), colorWhite , layer = 0, yposition = HaHigh, offset = 50);
_SECTION_END();
0 comments
Leave Comment
Please login here to leave a comment.