GANN Levels & Targets in the Light of Cross overs of MA20,MA50 & HMA26 for Amibroker (AFL)
tgbssk about 3 years ago Amibroker (AFL)
GANN Levels & Targets in the Light of Cross overs of MA20,MA50 & HMA26
By Abhimanyu Y. Altekar 21/05/2019 abhimanyu.altekar@gmail.com
In the memory of my deceased Mother
Modified GANN Square of Nine with separate Targets for each day.
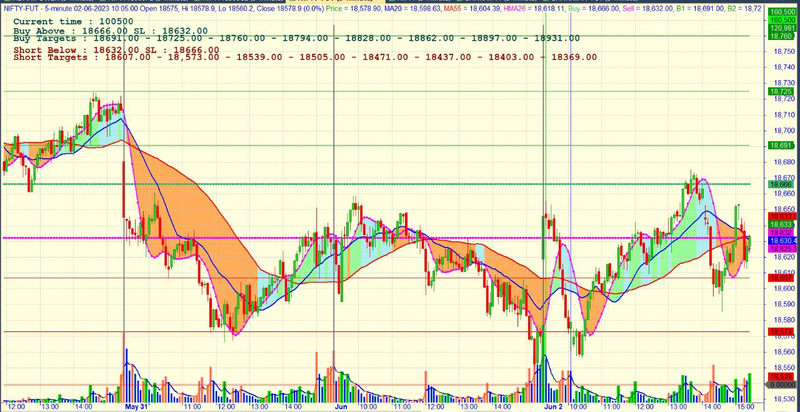
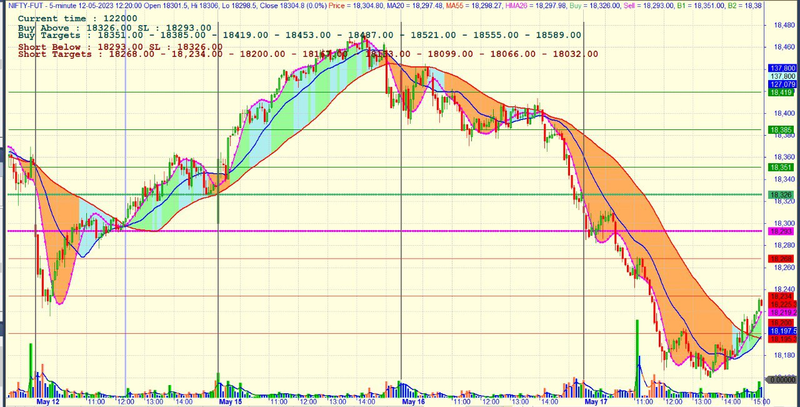
1) GANN Targets in the Light of Cross Overs of HMA26, MA20,MA50 The Logic is to see cross over of Averages and Cloud Colour around Some GANN Level
to take Intraday Position Each Day has Different GANN Levels 3 Basic and + 5 Extended. Consider GANN levels at Targets, support and resistance in the light of
the Cross Over of Averages
.
2) When MA20 AND MA50 are close to each other there is no point to trade
.
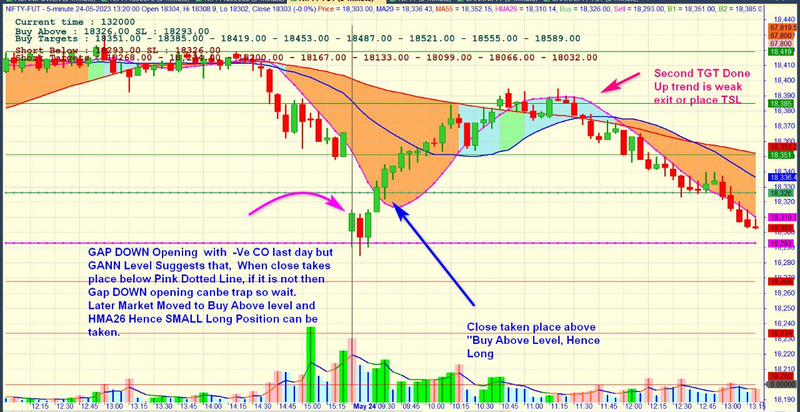
3) When MA20 MA50 are not having any sharp cross over formation THEN just follow Buy Above or
Sell Below advise Gi9ven by GANN, it may give some small opportunity to trade in flat market as per levels.
.
4) GANN levels and Averages are brought together to act complimentary and supplementary to each other.
Levels will be mostly different on each day.
.
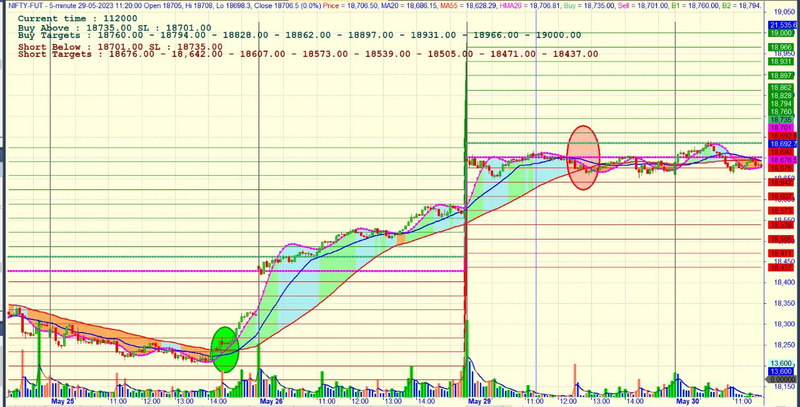
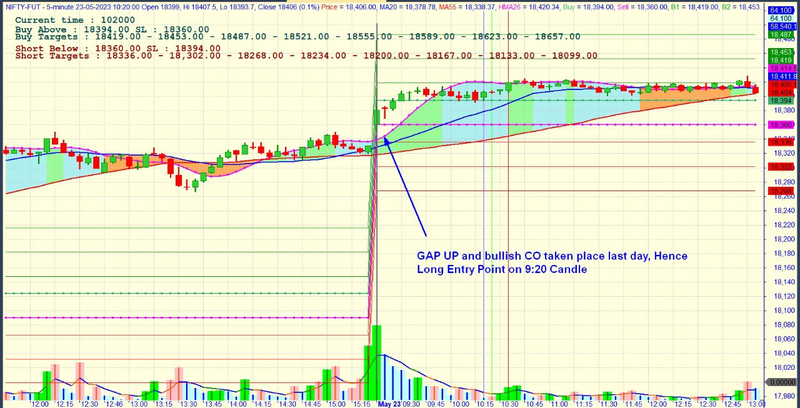
5)Whenever there is Gap on opening either Gap UP or Gap DOWN Just check that , what type of cross over has taken
place last day and find possibility of trend continuation for next day
.
6)Mostly all GANN levels will change every day but trend cloud will continue ahead with its colour if Trend is same and continue to extend for next day
.
7)All Cosmetic applied to analyze trend and its length. But simply MA50 & MA20 Play Significant Role with Trigger of HMA26
as possible starting point of Trend Change. Normally in any bullish trend extended for 2 days or more, has price above MA50 and versa-versa in bearish trend
Screenshots
Indicator / Formula
Includes Price Chart and can be used with RSI , MACD etc.
// GANN Levels & Targets in the Light of Cross overs of MA20,MA50 & HMA26
// By Abhimanyu Y. Altekar 21/05/2019 abhimanyu.altekar@gmail.com
// In the memory of my deceased Mother
// Modified GANN Square of Nine with separate Targets  for each day.

/*
1) GANN Targets in the Light of Cross Overs of HMA26, MA20,MA50 The Logic is to see cross over of Averages and Cloud Colour around Some GANN Level
to take Intraday Position Each Day has Different GANN Levels 3 Basic and + 5 Extended. Consider GANN levels at Targets, support and resistance in the light of
the Cross Over of Averages
.
2) When MA20 AND MA50 are close to each other there is no point to trade
.
3) When MA20 MA50 are not having any sharp cross over formation  THEN just follow Buy Above or
Sell Below advise Gi9ven by GANN, it may give some small opportunity to trade in flat market as per levels.
.
4) GANN levels and Averages are brought together to act complimentary and supplementary to each other.
Levels will be mostly different on each day.
.
5)Whenever there is Gap on opening either Gap UP or Gap DOWN Just check that ,  what type of cross over has taken
place last day and find possibility of trend continuation for next day
.
6)Mostly all GANN levels will change every day but trend cloud will continue ahead with its colour if Trend  is same and continue to extend  for next day
.
7)All Cosmetic applied to analyze trend and its length. But  simply MA50 & MA20 Play Significant Role with Trigger of HMA26
as possible starting point of Trend Change. Normally in any bullish trend extended for 2 days or more, has price above MA50 and versa-versa in bearish trend


*/


SetChartOptions(0,chartShowArrows|chartShowDates);
_N(Title = StrFormat("{{NAME}} - {{INTERVAL}} {{DATE}} Open %g, Hi %g, Lo %g, Close %g (%.1f%%) {{VALUES}}", O, H, L, C, SelectedValue( ROC( C, 1 ) ) ));
//Plot( C, "Close", ParamColor("Color", colorBlack ), styleNoTitle | ParamStyle("Style") | GetPriceStyle() );
_SECTION_END();

_SECTION_BEGIN("Title");
IsGann = ParamToggle("Show GANN?","No|Yes",1);
isfulgann =   ParamToggle("8 levels of GANN?","No|Yes",0);
isgannBS =ParamToggle("Show GANN B/S ?","No|Yes",1);
isVol =   ParamToggle("Show Volume ?","No|Yes",1);


V=IIf(V<=0,1,V);
DayStart = Day() != Ref(Day(), -1);
Plot(DayStart,"",colorGrey40,styleLine+styleHistogram+styleThick+styleOwnScale);


Plot( C, "Price", IIf( C > O, colorGreen, colorRed ), styleCandle )  ;

_SECTION_END();


_SECTION_BEGIN("GANN  Intraday Targets");
Plot (MA20=MA(C,20),"MA20",colorBlue, styleThick);
Plot (MA50=MA(C,50),"MA55",colorred, styleThick);
Plot(HMA26=HMA(C,26), "HMA26",colorcustom12, styleThick | styleDots);
RefH = ValueWhen(TimeNum() == 091500 OR DayStart , H,1);
RefL = ValueWhen(TimeNum() == 091500 OR DayStart , L,1);
color = IIf (HMA26> MA20, IIf( c > HMA26 AND ( C> MA50)  , colorPaleGreen, colorPaleTurquoise) ,IIf( MA20< HMA26 AND C < HMA26 ,    colorRose,colorLightOrange)) ;

plotOHLC ( HMA26, MA20, HMA26, MA20, "", Color , styleCloud | styleNoLabel , Null, Null, xshift=0,zorder=-6 );
plotOHLC (  MA20, MA50, MA20, MA50, "", Color , styleCloud | styleNoLabel , Null, Null, xshift=0,zorder=-7 );


BaseNum = (int(sqrt((RefL+RefH)/2))-1);
sBelow = BaseNum + BaseNum;
sBelowI = 1;

//Calculate levels for GANN Square of Nine

for( i = 1; i < 50; i++ )
{
VarSet( "GANN"+i, (BaseNum * BaseNum) );
BaseNum = BaseNum + 0.125;
sBelowI = IIf( VarGet("GANN"+i)< RefH, i, sBelowI);
bAboveI = sBelowI + 1;
sBelow = round(VarGet("GANN"+sBelowI));
bAbove = round(VarGet("GANN"+bAboveI));
}

// Resistance Levels (or Targets for Buy trade)
BTgt1 = round(0.9995 * VarGet("Gann"+(bAboveI+1)));
BTgt2 = round(0.9995 * VarGet("Gann"+(bAboveI+2)));
BTgt3 = round(0.9995 * VarGet("Gann"+(bAboveI+3)));
BTgt4 = round(0.9995 * VarGet("Gann"+(baboveI+4)));
BTgt5 = round(0.9995 * VarGet("Gann"+(bAboveI+5)));
BTgt6 = round(0.9995 * VarGet("Gann"+(baboveI+6)));
BTgt7 = round(0.9995 * VarGet("Gann"+(baboveI+7)));
BTgt8 = round(0.9995 * VarGet("Gann"+(baboveI+8)));
// Support Levels (or Targets for Short trade)
STgt1 = round(1.0005 * VarGet("Gann"+(sBelowI-1)));
STgt2 = round(1.0005 * VarGet("Gann"+(sBelowI-2)));
STgt3 = round(1.0005 * VarGet("Gann"+(sBelowI-3)));
STgt4 = round(1.0005 * VarGet("Gann"+(sbelowI-4)));
STgt5 = round(1.0005 * VarGet("Gann"+(sBelowI-5)));
STgt6 = round(1.0005 * VarGet("Gann"+(sBelowI-6)));
STgt7 = round(1.0005 * VarGet("Gann"+(sBelowI-7)));
STgt8 = round(1.0005 * VarGet("Gann"+(sBelowI-8)));


Sstop= round(babove-((babove-sbelow)/3)) ;
Bstop= round(sbelow+((babove-sbelow)/3)) ;

BuySignal = TimeNum()>091500 AND (Cross(H,babove)OR Cross(C,babove) OR (H>babove AND L<=babove)) AND C<babove AND MACD() > 0 AND C >MA20;
ShortSignal = TimeNum()>091500 AND (Cross(Sbelow,L) OR Cross(Sbelow,C) OR (H>=sbelow AND L<sbelow))AND C>sbelow ;
/*
BuySignal = ExRem(BuySignal,ShortSignal);
ShortSignal = ExRem(ShortSignal,BuySignal);

ShortProfitStop= (STgt1 AND L<=Stgt1 AND C>Stgt1) OR (STgt2 AND L<=Stgt2 AND C>Stgt2) OR (STgt3 AND L<=Stgt3 AND C>Stgt3) OR (STgt4 AND L<=Stgt4 AND C>Stgt4) OR (STgt5 AND L<=Stgt5 AND C>Stgt5) OR (STgt6 AND L<=Stgt6 AND C>Stgt6);
BuyProfitStop= (Btgt1 AND H>=btgt1 AND C<Btgt1) OR (Btgt2 AND H>=Btgt2 AND C<btgt2) OR (Btgt3 AND H>=Btgt3 AND C<btgt3) OR (Btgt4 AND H>=Btgt4 AND C<btgt4) OR (Btgt5 AND H>=Btgt5 AND C<btgt5) OR (Btgt6 AND H>=Btgt6 AND C<btgt6);

SetOption("MaxOpenPositions", 1 );
SetPositionSize(100,spsShares);

Buy = BuySignal  ;
Sell = C<Bstop OR BuyProfitStop;
Short = ShortSignal;
Cover = C>SStop OR ShortProfitStop;

Buy = ExRem(Buy,Sell);
Sell = ExRem(Sell,Buy);
Short = ExRem(Short,Cover);
Cover = ExRem(Cover,Short);
*/
if(isgannBS==1)
{
Plot(bAbove,"Buy",colorSeaGreen,styleDots,0,0,0,0,2);
Plot(sBelow,"Sell",colorCustom12,styleDots,0,0,0,0,2);
}
if(isGANN ==1)
{
	Plot(Btgt1,"B1",colorGreen,StyleLine);
	Plot(Btgt2,"B2",colorGreen,StyleLine);
	Plot(Btgt3,"B3",colorGreen,StyleLine);
		if(isfulgann ==1)
		{
		Plot(Btgt4,"B4",colorGreen,StyleLine);
		Plot(Btgt5,"B5",colorGreen,StyleLine);
		Plot(Btgt6,"B6",colorGreen,StyleLine);
		Plot(Btgt7,"B7",colorGreen,StyleLine);
		Plot(Btgt8,"B8",colorGreen,StyleLine);
		}

	Plot(Stgt1,"S1",colorred,StyleLine);
	Plot(Stgt2,"S2",colorred,StyleLine);
	Plot(Stgt3,"S3",colorred,StyleLine);
		if(isfulgann ==1)
		{
		Plot(Stgt4 ,"S4",colorred,StyleLine);
		Plot(Stgt5,"S5",colorred,StyleLine);
		Plot(Stgt6 ,"S6",colorred,StyleLine);
		Plot(Stgt7,"S7",colorred,StyleLine);
		Plot(Stgt8 ,"S8",colorred,StyleLine);
		}
}
Sstop= round(babove-((babove-sbelow)/3)) ;
Bstop= round(sbelow+((babove-sbelow)/3)) ;

GfxSetBkMode( 1 );
GfxSelectFont("Courier New", 12, 700 );
GfxSetTextColor( colordarkoliveGreen );
GfxSelectPen( colorBlack, 1, 0) ;
GfxSelectSolidBrush( colorWhite );
abv=WriteIf (TimeNum()>091500  , "Buy Above"+"   "+  NumToStr(bAbove,1.2,False) + " SL : " + NumToStr(sBelow,1.2,False),  "Waiting for Signal" );
blow= WriteIf(TimeNum()>091500,  "Short below"+"   "+NumToStr(sBelow,1.2,False) + " SL : " + NumToStr(bAbove,1.2,False),"Waiting for Signal");
BTgtext = "Buy Targets : " + NumToStr(btgt1,1.2,False) + " - " + NumToStr(btgt2,1.2,False) + " - " + NumToStr(btgt3,1.2,False)+ " - " + NumToStr(btgt4,1.2,False)+ " - " + NumToStr(btgt5,1.2,False)+ " - " + NumToStr(btgt6,1.2,False)+ " - " + NumToStr(btgt7,1.2,False)+ " - " + NumToStr(btgt8,1.2,False);
STgtext ="Short Targets : " + NumToStr(stgt1,1.2,False) + " - " + NumToStr(stgt2,1.2) + " - " + NumToStr(stgt3,1.2,False) + " - " + NumToStr(stgt4,1.2,False) +" - "+ NumToStr(stgt5,1.2,False) + " - " + NumToStr(stgt6,1.2,False)+" - "+ NumToStr(stgt7,1.2,False) + " - " + NumToStr(stgt8,1.2,False);
GfxTextOut("Current time : " + TimeNum(),25, 25);
;
GfxTextOut("Buy Above : " + WriteIf(TimeNum()>091500, NumToStr(bAbove,1.2,False) + " SL : " + NumToStr(sBelow,1.2,False),"Waiting for Signal"), 25, 45);
GfxTextOut(WriteIf(TimeNum()>091500,BTgtext,""), 25, 60);

GfxSetBkMode( 1 );
GfxSelectFont("courier new", 12, 700 );
GfxSetTextColor( colordarkRed );
GfxSelectPen( colorBlack, 1, 0) ;
GfxSelectSolidBrush( colorWhite );

GfxTextOut("Short Below : " + WriteIf(TimeNum()>091500, NumToStr(sBelow,1.2,False) + " SL : " + NumToStr(bAbove,1.2,False),"Waiting for Signal"), 25, 85);
GfxTextOut(WriteIf(TimeNum()>091500,STgtext,""), 25, 100);

AddColumn(Close,"Close",1.4);
AddColumn(Buysignal,"buysignal",1.2);


_SECTION_BEGIN("Volume");
PaneHght = Param( "Volume Pane Height (in %)", 20, 1, 100, 1 );
PaneHghtMin = LowestVisibleValue( V);
PaneHghtMax = HighestVisibleValue(V) * 100 / PaneHght;

gxs=Param("GRAPH spaceing",5,5,50,5);
GraphXSpace = gxs;

if (isVol == 1)
{

xcol1= IIf( C > Ref( C, -1 ) AND V > Ref( V, -1 ), colorGreen, IIf( C < Ref( C, -1 ) AND V > Ref( V, -1 ),colorOrange, colorBlue) );
xcol2= IIf( C > Ref( C, -1 ) AND V > Ref( V, -1 ), colorbrightGreen, IIf( C < Ref( C, -1 ) AND V > Ref( V, -1 ),colorpink, colorSkyblue) );

hz=EMA(Volume,5);
lz=EMA(Volume,9);
Plot( hz, "Vol", xcol1, Styleline|styleOwnScale  ,  PaneHghtMin, PaneHghtMax, 0, 0, 2 );
Plot( Volume, "", xcol1,  styleHistogram | styleOwnScale | styleThick | styleNoTitle , PaneHghtMin, PaneHghtMax, 0, 0, 2 );
Plot( Volume, "", xcol2,  styleArea | styleOwnScale | styleThick | styleNoTitle , PaneHghtMin, PaneHghtMax, 0, 0, 2 );


}
_SECTION_END();
3 comments
Leave Comment
Please login here to leave a comment.
I don’t add in amibroker 6.3
@manhbu
It should work for Amibroker version >= 6.0
Hi… abhimanyu.altekar@gmail.com
I am using this afl last one year…. in NSE index and stocks perfectly working…. i can make decision to take upside or downside using this bro… thanks for this….
P. Pradeep.