Market Facilitation Index - Bill Williams's for Amibroker (AFL)
zaroldo about 16 years ago Amibroker (AFL)
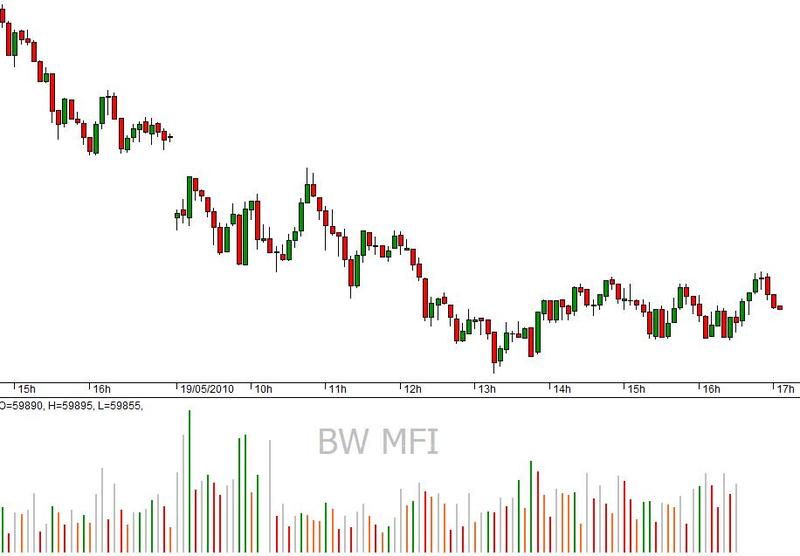
The Market Facilitation Index, developed by Dr. Bill Williams, reproduces volume and price characteristics in order to make the trade more accurate. 1 point price changing can be shown by BW MFI (Bill Williams Market Facilitation Index). You shouldn’t care about absolute indicator values, whether its changes are important. Bill Williams singles out following processes of MFI and volume changing:
Both MFI and volume go up. It means that more players are joining the market (volume increases), these players make bar development possible. It’s followed by movement commencing and taking higher speed.
Both MFI and volume go down. In this case the participants have lost their interest.
MFI rises while volume gets lower. This situation describes lack of ability for market to support the volume from customers. In this case the price varies according to the speculations of traders, brokers or dealers.
MFI decreases while volume rises. This situation is called the battle between bulls and bears. In this case the volumes being bought or sold are considerable whether the price doesn’t change much as far as the affecting forces are approximately at the same level. It is inevitable that either bulls or bears will win. In most cases the end of this process lets you see whether the trend is going on or it is about to change. According to Bill Williams it is called “curtsying”.
The calculation for the MFI is:
[High] – [Low] / Volume
Otherwise a “Fake” is considered to occur when the volume gets lower whether MFI increases. It’s called like this as far as there is no basis for trend changing apart from rising floor activity. Finally the price reverses.
The process of both MFI and volume falling is called a “Fade”. In this case the market is not interested and it causes a fade. The price trend is supposed to reverse.
The situation when the volume is high unlike the MFI which is low is called “Squat”. This can be compared to a sprinter crouching before the race start. Further changes are proved future trends.
In case both volume and MFI are up it is called “Green” and it gives a reliable indication of following the trend.
Screenshots
Indicator / Formula
_SECTION_BEGIN("MFI VS Volume");
Title = Name() +" ("+ FullName()+ ")  - "+" O="+O+", H="+H+", L="+L+",
C="+C+"\nDate:"+Date() +"\n MFI="+MFI()+"\n Volume="+Volume/10+"\n";
D0 = (High-Low)/Volume> Ref((High-Low)/Volume,-1) AND Volume > Ref( Volume, -1
);
D1 = (High-Low)/Volume< Ref((High-Low)/Volume,-1) AND Volume < Ref( Volume, -1
);
D2 = (High-Low)/Volume> Ref((High-Low)/Volume,-1) AND Volume < Ref( Volume, -1
);
D3 = (High-Low)/Volume< Ref((High-Low)/Volume,-1) AND Volume > Ref( Volume, -1
);

dynamic_color = IIf( D0, colorGreen, IIf( D3, colorRed, IIf( D1, colorOrange,
colorLightGrey )));
Plot ((High-Low)/Volume, "MFI", dynamic_color, styleHistogram | styleThick  );

SetChartBkColor( colorWhite);

WriteIf(D0,"Green\n=======\n A Green is a breakout signal and your best
immediate strategy is to go with whatever direction it is going.\n  A green
signifies three things:\n  1.More players are entering the market ( + Volume)\n
2.The arriving players are biased in the direction the bar is moving\n  3.The
price movement is picking up speed as it goes ( +MFI).","")+
WriteIf(D1,"Fade\n=======\n A Fade occurs when the market is taking a breath OR
losing interest.\n  A fade is the opposite of a green:\n both Volume AND MFI
(price movement) are less.\n  The stock market is an auction market,\n  AND the
bidders are losing interest.\n Often, the top of the first wave in an Elliott
wave sequence has a fade\n top,NOT a lot of action, AND the excitement of the
market is dwindling.\n  It is very important to point out that fade areas \n are
the start of big moves. So the very time when the market\n  is most boring is
exactly the time when a good trader must be on guard\n  for any sign that
momentum is building.\n","")+
WriteIf(D2,"Fake\n=======\n With a Fake, we have a situation where the MFI is
increasing, which \n means the market is facilitating itself\n   by moving price
through time but is NOT \n  supported by increasing Volume from Outside the
pit.\n  Therefore, the facilitation is less robust,\n  as indi-cated by the
decrease in raw Volume. \n for whatever reasons, the market is attracting less
Volume than in the previous period.\n  A fake sometimes indicates a pause in the
market action before\n  the market takes off.\n  Unless this situation is
followed shortly by increasing Volume,\n  the fake has probably been manipulated
by the locals in the pit.\n  The locals are in temporary control simply because
no significant Volume\n  of Outside paper is coming into the pit. \n The fake is
a trademark of pit manipulation AND should be viewed with\n  a High degree of
skepticism.\n The locals have sensed that a move is imminent during the lull in
the pit action.\n  This is the only time when the locals have enough power to
run your stops.\n  They will, if possible, take the market in the opposite\n
direction of the anticipated move, in order to acquire inventory\n  AND take the
other side of the anticipated paper coming into the pit.\n  They are building
their inventory so they can Sell the next rally\n  OR Buy the next decline
","")+
WriteIf(D3,"Squat\n=======\n A Squat is the strongest potential money maker of
the four Profitunity windows.\n Virtually all moves end with a squat as the
High/Low bar plus OR minus\n one bar of the same time period. Another way of
stating this is that\n all significant trends end with a squat on one of the
three top OR bottom bars.\n This analysis provides a potentially effective way
to get in on the beginning of a trend.\n while all trends end in a squat, all
squats are NOT the end of a trend.\n Squats appear quite often in the middle of
Elliott wave 3 AND at Fibonacci retracements\n AND Gann line intersections .If
it does NOT end the immediate \ntrend, it tends to become a measuring squat
(similar to a measuring gap) predicting how far the current move will
continue.\n This measuring squat gives us a target zone where we can look for
another squat that may end the current trend.\n Squats are characterized by a
greater tick Volume AND a lower MFI, \n AND, usually but NOT always, by a
smaller range than the previous bar.\n if you are trading Short-term charts
(intra-Day), a visual \nshorthand for a squat would be the same OR a smaller
range with a\n higher tick Volume (compared to the previous bar).\n The squat is
the last battle of the bears AND the bulls, with lots of buying AND selling \n
but little price movement. There is an almost equal division between the number
AND enthusiasm of both bears AND bulls.\n A real war is taking place AND the
equivalent of hand-to-hand combat is going on in the pits.\n I labeled this a
squat because it appears that the market is squatting, getting ready to leap one
way OR the other (often, in a reversal of the current trend).\n The market has
moved up OR down on substantial Volume, AND Now a flood of sellers OR buyers
enters the market. Volume increases,\n the trend is stalled, AND the price
movement virtually stops.\n The key is that the price movement stops on higher
Volume.\n One of the two opposing forces (buyers vs. sellers) will win, AND
usually the breakout of the squat \n will let you know whether this squat is a
trend continuation OR a trend reversal squat.","")+
Filter=1;
AddTextColumn( FullName(), "Full name", 77);
MFIvVol_status = WriteIf( D0, "Green", WriteIf( D1, "Fade", WriteIf (D2,
"Fake", "Squat")));
AddTextColumn(MFIvVol_status, "MFI v Volume", 1, colorWhite, dynamic_color);
AddColumn(Open,"Open",1.2);
AddColumn(High,"High",1.2);
AddColumn(Low,"Low",1.2);
AddColumn(Close,"Close",1.2);
AddColumn(Volume,"Volume",1);

_SECTION_END();

GfxSetOverlayMode(1);
GfxSelectFont("Tahoma", Status("pxheight")/6 );
GfxSetTextAlign( 6 );// center alignment
GfxSetTextColor( ParamColor( "Warna", colorLightGrey ) );
GfxSetBkMode(0); // transparent
GfxTextOut( "BW MFI", Status("pxwidth")/2, Status("pxheight")/8 );
0 comments
Leave Comment
Please login here to leave a comment.