Hilbert study for Amibroker (AFL)
realkaka about 16 years ago Amibroker (AFL)
Using the Hilbert Metastock code, my interpetation of this indicator that indicates whether a stock is trending or not. This is set up as a system buying in at the start of a trend.
Author: Steve Wiser
Screenshots
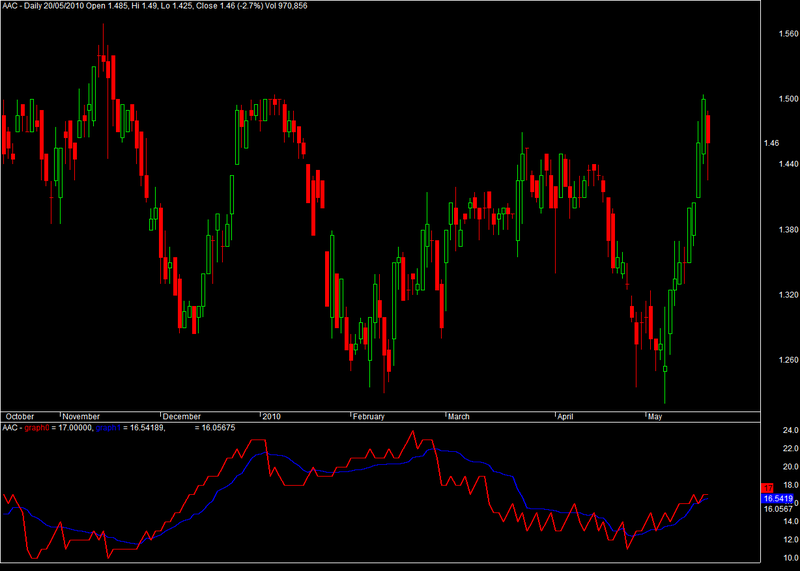
Indicator / Formula
Copy & Paste Friendly
/* Hilbert Study */

EnableScript("VBScript");
value1=((H+L)/2) - Ref(((H+L)/2),-6);
value2= Ref(value1,-3);
value3=0.75*(value1-Ref(value1,-6)) + 0.25*(Ref(value1,-2)-Ref(value1,-4));

<%
  value1 = AFL("Value1")
  value2 = AFL("Value2")
  value3 = AFL("Value3")
  Close = AFL("Close")
  inphase = Close
  quad = inphase

Call Setup()

Function Setup()
	for i = 1 to Ubound(close)
	   inphase(i) =  0.33 * value2(i) + (0.67 * inphase(i-1) )
                   quad(i)    = 0.20  * value3(i) + ( 0.8 * quad(i-1) )
	next
End Function

AFL.Var("inphase") = inphase
AFL.Var("quad") = quad
%>
p1  =  Atan(
                   Abs(quad+Ref(quad,-1) )   / Abs(inphase+Ref(inphase,-1) )
                 )
                  *     360 /3.1416;
phase = IIf(inphase<0 AND quad>0, 180-p1,
  IIf(inphase<0 AND quad<0, 180+p1,
  IIf(inphase>0 AND quad<0, 360-p1,p1)));
dp  =  IIf(Ref(phase,-1)<90 AND phase>270, 360+Ref(phase,-1)-phase,Ref(phase,-1)-phase);
dp2 = IIf(dp < 1, 1,
  IIf(dp > 60, 60, dp));

Graph1 = dp2;

HilbertCyclePeriod1a = dp2;
value = dp2;

HCycleCount1a=
IIf(Sum(value,6)>=360 AND Sum(value,5)<360 ,6,0) +
IIf(Sum(value,7)>=360 AND Sum(value,6)<360 ,7,0) +
IIf(Sum(value,8)>=360 AND Sum(value,7)<360 ,8,0) +
IIf(Sum(value,9)>=360 AND Sum(value,8)<360 ,9,0) +
IIf(Sum(value,10)>=360 AND Sum(value,9)<360 ,10,0) +
IIf(Sum(value,11)>=360 AND Sum(value,10)<360 ,11,0) +
IIf(Sum(value,12)>=360 AND Sum(value,11)<360 ,12,0) +
IIf(Sum(value,13)>=360 AND Sum(value,12)<360 ,13,0) +
IIf(Sum(value,14)>=360 AND Sum(value,13)<360 ,14,0) +
IIf(Sum(value,15)>=360 AND Sum(value,14)<360 ,15,0);

HCycleCount2a =
IIf(Sum(value,16)>=360 AND Sum(value,15)<360 ,16,0) +
IIf(Sum(value,17)>=360 AND Sum(value,16)<360 ,17,0) +
IIf(Sum(value,18)>=360 AND Sum(value,17)<360 ,18,0) +
IIf(Sum(value,19)>=360 AND Sum(value,18)<360 ,19,0) +
IIf(Sum(value,20)>=360 AND Sum(value,19)<360 ,20,0) +
IIf(Sum(value,21)>=360 AND Sum(value,20)<360 ,21,0) +
IIf(Sum(value,22)>=360 AND Sum(value,21)<360 ,22,0) +
IIf(Sum(value,23)>=360 AND Sum(value,22)<360 ,23,0) +
IIf(Sum(value,24)>=360 AND Sum(value,23)<360 ,24,0) +
IIf(Sum(value,25)>=360 AND Sum(value,24)<360 ,25,0);

HCyclecount3a =
IIf(Sum(value,26)>=360 AND Sum(value,25)<360 ,26,0) +
IIf(Sum(value,27)>=360 AND Sum(value,26)<360 ,27,0) +
IIf(Sum(value,28)>=360 AND Sum(value,27)<360 ,28,0) +
IIf(Sum(value,29)>=360 AND Sum(value,28)<360 ,29,0) +
IIf(Sum(value,30)>=360 AND Sum(value,29)<360 ,30,0) +
IIf(Sum(value,31)>=360 AND Sum(value,30)<360 ,31,0) +
IIf(Sum(value,32)>=360 AND Sum(value,31)<360 ,32,0) +
IIf(Sum(value,33)>=360 AND Sum(value,32)<360 ,33,0) +
IIf(Sum(value,34)>=360 AND Sum(value,33)<360 ,34,0) +
IIf(Sum(value,35)>=360 AND Sum(value,34)<360 ,35,0);

c1=  HCycleCount1a + HCycleCount2a + HCycleCount3a;
/*
graph0 = HCycleCount1a;
graph1 = HCyclecount2a;
Graph2 = HCyclecount3a;
Graph0Style=Graph1Style=Graph2Style=5;
*/
<%
c1 = AFL("c1")
c2 = c1
c3 = c1
	for i = 1 to Ubound(c1)
                      IF c1(i) = 0 then c2(i) = c2(i-1) else c2(i) = c1(i)
                      c3(i) = 0.25*c2(i) + 0.75*c3(i-1)
                next

AFL.Var("quad") = c1
%>

graphXspace = 1;

/* playing a little here with moving averages, the Hilbert curve
    using Amibroker seems a lot more jagged than the one
    produced using Metastock.  I do not understand this
   difference but using a moving average produces a curve
   that is closer to Metastocks results than the one that I
   produced as an interpetation.  */

fast = 2/(2+1);
slow = 2/(30+1);
dir=abs(close-ref(close,-5));
vol=sum(abs(close-ref(close,-1)),5);
ER=dir/vol;
sc =( ER*(fast-slow)+slow)^2;

graph0 = c1;
graph1 = ama( c1, sc );
graph2 = ema(c1,9);

graph0style=graph1style=graph2style=4;

/* Squelch  here is used as 15 instead of 20 on the site */
Squelch = 15;

var1 = graph2;
buy = IIF(var1 < Squelch , 0 , 1);
sell = IIF( var1 < Squelch ,  1, 0 );
buy = exrem(buy,sell);
sell = exrem(sell,buy);

/* Exploration code */

/* filter is setup so that you can test any particular date and
   see the followup performance.  Just make sure that that
   date is at least 3 * first days in the past from the current
   date, otherwise the future references will produce the
   wrong information or no information useful */

Filter = Buy==1;

first=1;
/* First is the number of days for each ROC interval for reviewing performance */

numcolumns = 7;
column0 = C;
column0format = 1.2;
column0name = "Close";
column1 = ref(C, 1+first);
column1name = "Close+i ";
column1format = 1.2;
column2 = ref(C,1+first*2);
column2name = "Close+i*2   ";
column2format = 1.2;
column3 =  ref(C,1+first*3);
column3name = "Close+i*3 ";
column3format = 1.2;
column4= ref(C,first*1+1)  -  C;
column4name="ROC+i";
column4format = 1.2;
column5=  ref(C,first*2+1)  -  C;
column5name="ROC+2i";
column5format = 1.2;
column6=  ref(C,first*3+1)  -  C;
column6name="ROC+3i";
column6format = 1.2;

/*  End of Exploration Code. */
1 comments
Leave Comment
Please login here to leave a comment.
how to erase the moving average the black line in this formula