miftha indicator for Amibroker (AFL)
coolpace about 16 years ago Amibroker (AFL)
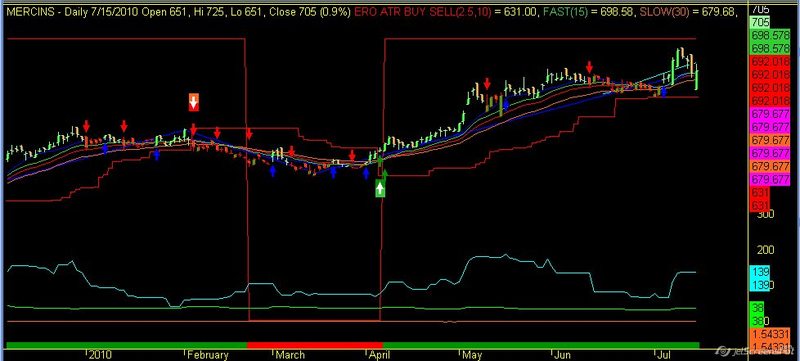
it a fine indicator for dse in bangladesh.only bangladashi trader enjoy it,other i can not test ………….
Screenshots
Indicator / Formula
Copy & Paste Friendly
//4-Day-Range Switch
prev=AMA2(C,1,0);
d=IIf(C>Ref(Max(Max(H,Ref(H,-3)),Max(Ref(H,-1),Ref(H,-2))),-1),Min(Min(L,Ref(L,-3)),Min(Ref(L,-1),Ref(L,-2))),
  IIf(C<Ref(Min(Min(L,Ref(L,-3)),Min(Ref(L,-1),Ref(L,-2))),-1),Max(Max(H,Ref(H,-3)),Max(Ref(H,-1),Ref(H,-2))),PREV));
a=Cross(Close,d);
b=Cross(d,Close);
state=IIf(BarsSince(a)<BarsSince(b),1,0);
s=state>Ref(state,-1);
ss=state<Ref(state,-1);
sss=state==Ref(state,-1);
col=IIf(state == 1 ,51,IIf(state ==0,4,1));
Plot(C,"",Col,128);
PlotShapes( shapeUpArrow * s ,6,0,L);
PlotShapes( shapeDownArrow *ss ,4,0,H);

Filter =  s OR sss OR sss  ;
AddColumn(C,"close",1.2);
AddColumn( IIf( s, 66,1 ), "buy", formatChar, 1, bkcolor =IIf (s,colorGreen, colorRed ));
AddColumn( IIf( Ss, 83,1 ), "sell", formatChar, 1, bkcolor =IIf (Ss,colorRed, colorGreen ));
AddColumn( IIf( sss, 87,1 ), "wait", formatChar, 1, bkcolor =IIf (sss,colorYellow, colorRed ));

//_SECTION_BEGIN("");
//_N(Title = "{{NAME}} - {{INTERVAL}} {{DATE}}: "+_DEFAULT_NAME()+" : {{OHLCX}} {{VALUES}}"
//+"\n"+EncodeColor(colorYellow)+
//WriteIf(s,"EXIT all Short positions\nif trading long positions, enter long Now-\nOR at the market price on tomorrow's Open with stop="+EncodeColor(4)+WriteVal(L+.75*ATR(5),1.4)+",","")+
//WriteIf(ss,"exit all long positions today with a Market On Close (MOC) order\nOR at the market price on tomorrow's Open with stop="+EncodeColor(4)+WriteVal(Ref(H+.75*ATR(5), -1),1.4)+",","")+
//WriteIf( sss ,"No trading signals today.","") );

AlertIf( s, "SOUND D:\songs\bhi.mp3", "Audio alert", 2 );
AlertIf( ss, "SOUND C:\\Windows\\Media\\Ding.wav", "Audio alert", 5 );
// ****************************************************************************************
_SECTION_BEGIN("ERO ATR BUY SELL");

ero = Param("ATR multiple", 2.5, 0.5, 10, 0.1 )*Param("ATR period", 10, 3, 50 );
ero_col=ParamColor( "Color", colorCycle );

r=HHV(H,ero);
s=LLV(L,ero);
ab=IIf(H>Ref(r,-1),1,IIf(L<Ref(s,-1),-1,0));
ac=ValueWhen(ab!=0,ab,1);
sl=IIf(ac==1,s,r);

Plot(sl, _DEFAULT_NAME(), ero_col, styleStaircase); // or styleaArea

Buy=Cross(H,sl);
Sell=Cross(sl,L);
PlotShapes(IIf(Buy, shapeSquare, shapeNone),colorGreen, 0, L, Offset=-40);
PlotShapes(IIf(Buy, shapeSquare, shapeNone),colorLime, 0,L, Offset=-50);
PlotShapes(IIf(Buy, shapeUpArrow, shapeNone),colorWhite, 0,L, Offset=-45);
PlotShapes(IIf(Sell, shapeSquare, shapeNone),colorRed, 0, H, Offset=40);
PlotShapes(IIf(Sell, shapeSquare, shapeNone),colorOrange, 0,H, Offset=50);
PlotShapes(IIf(Sell, shapeDownArrow, shapeNone),colorWhite, 0,H, Offset=-45);
_SECTION_END();

_SECTION_BEGIN("FAST");
P = ParamField("Price field",-1);
Periods =Param("periods",15,2,300,1,10);
Plot(EMA(P,Periods),_DEFAULT_NAME(),  colorLime, styleLine);
_SECTION_END();

_SECTION_BEGIN("SLOW");
P = ParamField("Price field",-1);
Periods = Param("periods", 30, 2, 300, 1, 10 );
Plot( EMA( P, Periods ), _DEFAULT_NAME(), colorOrange, styleLine);
_SECTION_END();

_SECTION_BEGIN("Price");
SetChartOptions(0,chartShowArrows|chartShowDates);
_N(Title = StrFormat("{{NAME}} - {{INTERVAL}} {{DATE}} Open %g, Hi %g, Lo %g, Close %g (%.1f%%) {{VALUES}}", O, H, L, C, SelectedValue( ROC( C, 1 ) ) ));
Plot( C, "Close", ParamColor("Color", colorBlack ), styleNoTitle | ParamStyle("Style") | GetPriceStyle() );
_SECTION_END();
// ****************************************************************************************
// Dave Landry Pullback Scan.
// Coded by Dennis Skoblar 6/8/2005.
// As adapted by "Dave Landry On Swing Trading" and "Dave Landry's 10 Best Swing Trading Patterns And Strategies".
// Special "Thank You" to Dave Landry, the Yahoo Groups Amibroker Club and the Amibroker Support Staff for thier help.
//
// This is best used as an Exploration, all the ColumnNames can be seen and used as filters.
// Drop the "Tools" drop down menu in the Formula Editor containing this code and toggle the "Apply Indicator" to get the chart layout displayed.
// Best used against a black background.

//======================= Variables ==================================================================================================================

// PullBack Parameters
DLL1 = Ref(H,-1) > Ref(HHV(H,20),-2) AND H < Ref(H,-1);
DLL2 = Ref(H,-2) > Ref(HHV(H,20),-3) AND H < Ref(H,-2);
DLL3 = Ref(H,-3) > Ref(HHV(H,20),-4) AND H < Ref(H,-3);
DLL4 = Ref(H,-4) > Ref(HHV(H,20),-5) AND H < Ref(H,-4);
DLL5 = Ref(H,-5) > Ref(HHV(H,20),-6) AND H < Ref(H,-5);
DLL6 = Ref(H,-6) > Ref(HHV(H,20),-7) AND H < Ref(H,-6);
DLL7 = Ref(H,-7) > Ref(HHV(H,20),-8) AND H < Ref(H,-7);
DLL8 = Ref(H,-8) > Ref(HHV(H,20),-9) AND H < Ref(H,-8);
DLL= H < Ref(HHV(H,20),-1);
DLS1 = Ref(L,-1) < Ref(LLV(L,20),-2) AND L > Ref(L,-1);
DLS2 = Ref(L,-2) < Ref(LLV(L,20),-3) AND L > Ref(L,-2);
DLS3 = Ref(L,-3) < Ref(LLV(L,20),-4) AND L > Ref(L,-3);
DLS4 = Ref(L,-4) < Ref(LLV(L,20),-5) AND L > Ref(L,-4);
DLS5 = Ref(L,-5) < Ref(LLV(L,20),-6) AND L > Ref(L,-5);
DLS6 = Ref(L,-6) < Ref(LLV(L,20),-7) AND L > Ref(L,-6);
DLS7 = Ref(L,-7) < Ref(LLV(L,20),-8) AND L > Ref(L,-7);
DLS8 = Ref(L,-8) < Ref(LLV(L,20),-9) AND L > Ref(L,-8);
DLS = L > Ref(LLV(L,20),-1);

// Price and Volume
PVFilter = (C>15) AND Ref(MA(V,50),-1)>100000;

// Dave Landry PullBack Scan
DLPBS = ((DLL AND (DLL1 OR DLL2 OR DLL3 OR DLL4 OR DLL5 OR DLL6 OR DLL7 OR DLL8)) OR (DLS AND (DLS1 OR DLS2 OR DLS3 OR DLS4 OR DLS5 OR DLS6 OR DLS7 OR DLS8))) AND PVFilter;

// Moving Average Proper Order
MAProperOrder = (MA(C,10) > EMA(C,20) AND EMA(C,20) > EMA(C,30)) OR (MA(C,10) < EMA(C,20) AND EMA(C,20) < EMA(C,30));

// How far the stock has moved in the past month (preferable at least 10 pts in the past 20 days)
TenTwentyFilter = HHV(H,20)-LLV(L,20);

// 50 Day Historical Volatility
FiftyDayHVFilter = round(StDev(log(C/Ref(C,-1)),50)*100*sqrt(256));

// 6/100 Historical Volatility
HVSixOneHundred = (StDev(log(C/Ref(C,-1)),6)*100*sqrt(256)) / (StDev(log(C/Ref(C,-1)),100)*100*sqrt(256));

//=================== End Variables =================================================================================================================

//=================== Columns =======================================================================================================================

NumColumns = 6;

Column0 = FullName();
Column0Name = "Ticker name";

Column1     = DLL AND (DLL1 OR DLL2 OR DLL3 OR DLL4 OR DLL5 OR DLL6 OR DLL7 OR DLL8);
Column1Name = "Buy Signal";

Column2     = DLS AND (DLS1 OR DLS2 OR DLS3 OR DLS4 OR DLS5 OR DLS6 OR DLS7 OR DLS8);
Column2Name = "Sell Signal";

Column3     = HVSixOneHundred;
Column3Name  = "HV6/100 Value";

Column4      = FiftyDayHVFilter;
Column4Name   ="HV50 Value";

Column5     = TenTwentyFilter;
Column5Name = "10/20 Value";

AddTextColumn( IndustryID(1), "Industry" );

AddTextColumn( MarketID(1), "Market" );

//==================== End Columns ===================================================================================================================

//==================== Filter and Buy/Sell criteria ==================================================================================================

// Filter based on 20 day hi/lo pullback, price and volume criteria.
Filter = DLPBS; // Delete this line and use the next line if you desire the moving averages to be scanned in "proper order".
//Filter = DLPBS AND MAProperOrder;
Buy  = Column1;
Sell = Column2;

//====================  End Filter and Buy/Sell criteria =============================================================================================

//======================= Chart Layout  ==============================================================================================================

// OHLC bar graph with headings
_SECTION_BEGIN("Price");
SetChartOptions(0,chartShowArrows|chartShowDates);
_N(Title = StrFormat("{{NAME}} - {{INTERVAL}} {{DATE}} Open %g, Hi %g, Lo %g, Close %g (%.1f%%) {{VALUES}}", O, H, L, C, SelectedValue( ROC( C, 1 ) ) ));
Plot( C, "Close", ParamColor("Color", colorYellow ), styleBar | ParamStyle("Style") | GetPriceStyle() );
_SECTION_END();

// 20 period linear regression line
x = Cum(1); //
lastx = LastValue( x ); Daysback = 20; aa = LastValue( LinRegIntercept( Close, Daysback) );
bb = LastValue( LinRegSlope( Close, Daysback ) );
y = Aa + bb * ( x - (Lastx - DaysBack) );
Plot( IIf( x >= (lastx - Daysback), y, -1e10 ), "LinReg", colorCustom11 );

PlotForeign(GetBaseIndex(),IndustryID(1),colorWhite,styleLine|styleLeftAxisScale);

// 10 period SMA
_SECTION_BEGIN("MA");
P = ParamField("Price field",-1);
Periods = Param("Periods",10 );
Plot( MA( P, Periods ), _DEFAULT_NAME(), ParamColor( "Color", colorBlue ), ParamStyle("Style") );
_SECTION_END();

// 20 period EMA
_SECTION_BEGIN("EMA");
P = ParamField("Price field",-1);
Periods = Param("Periods", 20 );
Plot( EMA( P, Periods ), _DEFAULT_NAME(), ParamColor( "Color", colorRed ), ParamStyle("Style") );
_SECTION_END();

// 30 period EMA
_SECTION_BEGIN("EMA1");
P = ParamField("Price field",-1);
Periods = Param("Periods", 30);
Plot( EMA( P, Periods ), _DEFAULT_NAME(), ParamColor( "Color", colorCustom12 ), ParamStyle("Style") );
_SECTION_END();

// Add the 10-20 filter, 50 Day HV and 6/100 Day HV as a different screen, just cut and paste each one to a separate Formula Editor Sceen and save them under
// Custom Indicators...then drop them into the main screen.

// 10-20 filter
 _SECTION_BEGIN("TenTwentyValue");
 TenTwentyValue = HHV(H,20)-LLV(L,20);
 Plot(TenTwentyValue,"10/20 Value",colorCustom11,styleLine);
 _SECTION_END();

// 50 day historical volotility
 _SECTION_BEGIN("HV50");
 HV50 = round(StDev(log(C/Ref(C,-1)),50)*100*sqrt(256));
 Plot(HV50,"HV50",colorBrightGreen,styleLine);
 _SECTION_END();

// 6/100 day historical volotility
 _SECTION_BEGIN("HVSixOneHundred");
 HVSixOneHundred = (StDev(log(C/Ref(C,-1)),6)*100*sqrt(256)) / (StDev(log(C/Ref(C,-1)),100)*100*sqrt(256));
 Plot(HVSixOneHundred,"HV 6/100",colorOrange,styleLine);
 _SECTION_END();

//======================= Variables =================================================================

_SECTION_BEGIN("Price");
SetChartOptions(0,chartShowArrows|chartShowDates);
_N(Title = StrFormat("{{NAME}} - {{INTERVAL}} {{DATE}} Open %g, Hi %g, Lo %g, Close %g (%.1f%%) {{VALUES}}", O, H, L, C, SelectedValue( ROC( C, 1 ) ) ));
Plot( C, "Close", ParamColor("Color", colorBlack ), styleNoTitle | ParamStyle("Style") | GetPriceStyle() );
_SECTION_END();

_SECTION_BEGIN("EMA");
P = ParamField("Price field",-1);
Periods = Param("Periods", 15, 2, 300, 1, 10 );
Plot( EMA( P, Periods ), _DEFAULT_NAME(), ParamColor( "Color", colorCycle ), ParamStyle("Style") );
_SECTION_END();

_SECTION_BEGIN("EMA1");
P = ParamField("Price field",-1);
Periods = Param("Periods", 15, 2, 300, 1, 10 );
Plot( EMA( P, Periods ), _DEFAULT_NAME(), ParamColor( "Color", colorCycle ), ParamStyle("Style") );
_SECTION_END();
/* Create date: 06 Jun 2010
The EMA crosses above the EMA on the current bar */

Buy = Cross( EMA( Close, 10 ), EMA( Close, 26 ) );

Sell = Cross( EMA( Close, 26 ), EMA( Close, 10 ) );

shape = Buy * shapeUpArrow + Sell * shapeDownArrow;
PlotShapes( shape, IIf( Buy, colorGreen, colorRed ), 0, IIf( Buy, Low, High ) );

GraphXSpace = 5;

//======================= Variables =================================================================

    array = Close;
    amount = Param("Amount", 15.5, 1, 50, 0.5 );
    zz0 = Zig( array, amount );
    zz1 = Ref( zz0, -1 );
    zz2 = Ref( zz0, -2 );
    tr = ValueWhen(zz0 > zz1 AND zz1 < zz2, zz1);
    pk = ValueWhen(zz0 < zz1 AND zz1 > zz2, zz1);
    PU = tr + 0.01 * abs(tr)*amount;
    PD = pk - 0.01 * abs(pk)*amount;
    ZZT = IIf( array >= PU AND zz0 > zz1, 1,
    IIf( array <= PD AND zz0 < zz1, -1, 0 ) );
    ZZT = ValueWhen( ZZT != 0, ZZT );
    // plot price bar chart
    Plot( Close, "Price", colorBlack, styleBar );
    // plot Zigzag and zigzag trend
    Plot( ZZT, "ZigZagTrend", colorRed, styleOwnScale );
    Plot( zz0, "ZigZag line", colorBlue, styleThick );
    // Plot the ribbon
    ribboncol= IIf( ZZT > 0, colorGreen, colorRed );
    Plot( 2, "ZZT Ribbon", ribboncol, styleArea | styleOwnScale | styleNoLabel, 0, 100 );
    GraphXSpace = 10;
    Buy = Cover = Cross( ZZT, 0 );
    Sell = Short = Cross( 0, ZZT );
    // plot arrows
    PlotShapes( Buy + 2 * Sell, ribboncol, 0, IIf( Buy, L, H ), -30 );
1 comments
Leave Comment
Please login here to leave a comment.
Great !
At least i found one nice DSE indicator for trading.
But, some of the interpretation is tough! Can someone help us to interpretate this chart?
Good luck
Mahsud
mahsud2000@yahoo.com