open brake system for Amibroker (AFL)
pit65 about 16 years ago Amibroker (AFL)
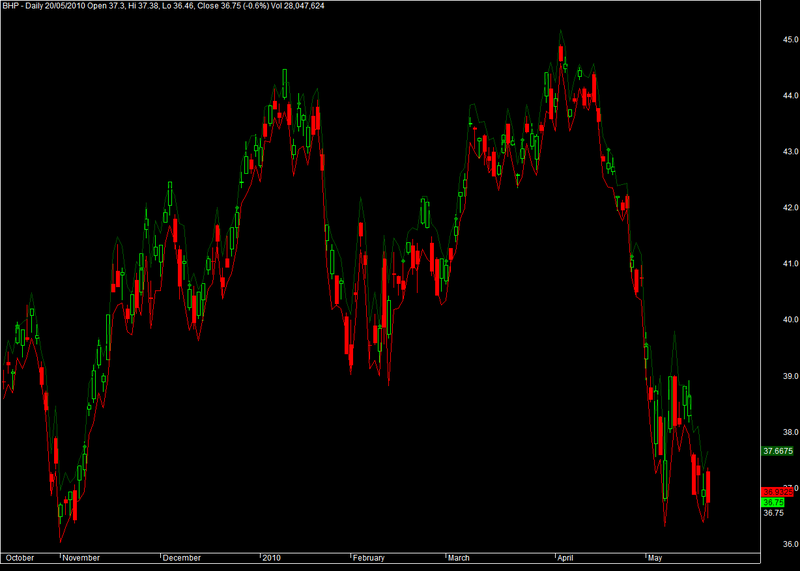
Brake canal price tested on daily .
For trendy markets.
Screenshots
Indicator / Formula
Copy & Paste Friendly
_SECTION_BEGIN("bbs");
//SetOption("PriceBoundChecking",False);
SetChartOptions(0, chartShowDates);
SetPositionSize(1,spsShares);
//SetBacktestMode( backtestRegularRaw  );
//zakres=(Ref(HHV(H,3),-1) - Ref(LLV(L,3),-1))/2;


zakres3=(Ref(HHV(H,3),-1) - Ref(LLV(L,3),-1));
zakres2=(Ref(HHV(H,2),-1) - Ref(LLV(L,2),-1))*2;
zakres1=(Ref(HHV(H,1),-1) - Ref(LLV(L,1),-1))*3;
zakres=((zakres3+zakres2+zakres1)/6)*0.5;

V0=13;
V1=66;
FrLv0=Optimize( "a", 1, 1, 1, 0.1 );
FrLv1=Optimize( "b", 1, 1, 1, 0.1 );
FrSv0=Optimize( "c", 1, 1, 1, 0.1 );
FrSv1=Optimize( "d", 1, 1, 1, 0.1 );
ML=(FrLv1 - FrLv0)/(V1 - V0);
BL = FrLv0 - (ML * V0);
MS = (FrSv1 - FrSv0)/(V1 - V0);
BS = FrSv0 - (MS * V0);
FrL = ML * zakres + BL;
FrS = MS * zakres + BS;


pl=EMA(O+(FrL*zakres),1);
pd=EMA(O-(FrS*zakres),1);

BuyPrice=CoverPrice=pl;
ShortPrice=SellPrice=pd;

Cover=Buy=Cross(H,BuyPrice);
Sell=Short=Cross(ShortPrice,L);

//Buy=ExRem(Buy,Sell);
//Sell=ExRem(Sell,Buy);
//Short=ExRem(Short,Cover);
//Cover=ExRem(Cover,Short);

//e = Equity(1,0);


E=Equity(1); // THIS EVALUATES STOPS


//Plot( e, "Equity", colorRed, styleLeftAxisScale);
//GraphXSpace=10;


TradeEquity = ValueWhen(Sell OR Cover,E);

if(ParamToggle("wykresy","hide|show",1) )
{
Plot( pl, "", colorDarkGreen, styleLine );
Plot( pd, "", colorRed, styleLine );
//Plot( Close, "", colorBlack, styleCandle );
PlotShapes(shapeSmallCircle*(Buy),colorGreen,0,BuyPrice,0);
//Plot(Sell==3,"ApplyStop Sell",colorRed,1|styleOwnScale);
PlotShapes(IIf( Sell==2, shapeDigit3, shapeNone), colorRed, 0, SellPrice, 0 );
//PlotShapes( Sell* shapeDigit3, colorRed, 0, SellPrice, 0 );
PlotShapes(shapeSmallCircle*(Short),colorRed,0,ShortPrice,0);
PlotShapes(IIf( Cover==2, shapeDigit1, shapeNone), colorGreen, 0, CoverPrice, 0 );
//PlotShapes(Cover*shapeDigit1, colorGreen, 0, CoverPrice, 0 );

//Plot(Cover==2,"ApplyStop Cover",colorGreen,1|styleOwnScale);
}
if(ParamToggle("Equity curve","HIDE|SHOW",0) )
{
Plot(TradeEquity,"",2,styleStaircase|styleOwnScale);
}

_SECTION_END();

_SECTION_BEGIN("Price1");
SetChartOptions(0,chartShowArrows|chartShowDates);
_N(Title = StrFormat("{{NAME}} - {{INTERVAL}} {{DATE}} Open %g, Hi %g, Lo %g, Close %g (%.1f%%) {{VALUES}}", O, H, L, C, SelectedValue( ROC( C, 1 ) ) ));
Plot( C, "Close", ParamColor("Color", colorBlack ), styleNoTitle | ParamStyle("Style") | GetPriceStyle() );
_SECTION_END();
0 comments
Leave Comment
Please login here to leave a comment.