Detekcja Buy / Sell for Amibroker (AFL)
leszcz about 15 years ago Amibroker (AFL)
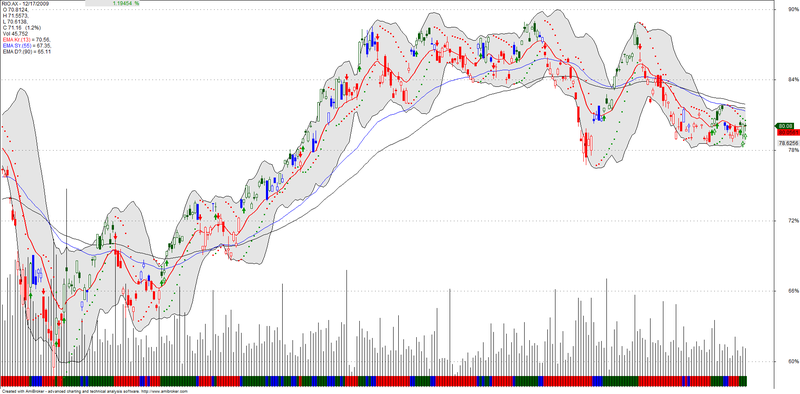
System generuje sygnały Buy / Sell analizując MACD, EMA, Parabolic SAR,RSI oraz Wstęgę Bollingera.
Screenshots
Indicator / Formula
Copy & Paste Friendly
 _SECTION_BEGIN(" MACD przebija Signal i ros'nie ");
///////Warunki Kupna////////////
////////MACD > Signal i ros'nie //////
Filter1 = MACD( 12, 26 ) > Signal( 12, 26, 9 ); /* MACD jest wie;kszy niz. Signal */
Filter2 =MACD( 12, 26 ) > Ref(MACD( 12, 26 ), -1 )*1.00; /* MACD ros'nie */
Cond1 = Filter1 AND Filter2 ;
_SECTION_END();

_SECTION_BEGIN("Close przebi? w góre; EMA");
///////Warunki Kupna////////////
PeriodsEMA13 = Param( "EMA Period", 13, 2, 20 );
Filter3 = EMA( Close, PeriodsEMA13 ) > Ref( EMA( Close, PeriodsEMA13 ), -1 )*1.0 ; /* EMA( Close, PeriodsEMA13 ) ros'nie */
Filter4 = Close > EMA( Close, PeriodsEMA13 ); /* Close > EMA( Close, PeriodsEMA13  ) */
PeriodsEMA13 = Param( "EMA Period", 13, 2, 20 );
Cond2 = Filter3 AND Filter4 ;
_SECTION_END();

_SECTION_BEGIN(" Parabolic SAR ");

///////Warunek Kupna////////////
////////  Optymalizacja Parabolic SAR  //////
SARfast = Optimize( "SAR Fast", 0.02, 0.01, 0.06, 0.01 );
SARslow = Optimize( "SAR Slow", 0.2, 0.1, 0.4, 0.1 );
////////  Parabolic SAR - Kupno //////
Filter5 = SAR(SARfast, SARslow) < Close; /* Parabolic SAR jest < niz. Close */
Cond3 = Filter5;
_SECTION_END();

_SECTION_BEGIN(" RSI przebija w góre; poziom 30 i MACD ros'nie ");
///////Warunki Kupna////////////

////////RSI przebija poziom 30 //////
Filter6 = Ref( RSI(), -2)  < 28 ; // przedwczoraj RSI < 28 //
Filter7 = Cross( RSI(), 30 );; // RSI przebija poziom 30 //

////////MACD ros'nie //////
Filter8 =MACD( 12, 26 ) > Ref(MACD( 12, 26 ), -1 )*1.03; /* MACD ros'nie */
Cond4 = Filter6 AND Filter7 AND Filter8;
_SECTION_END();

_SECTION_BEGIN("Close przebi?  Górna; Wste;ge; Bollingera");
///////Warunek Kupna////////////
Cond5 =  Close > BBandTop( Close, 15, 2 ) ; /* Close przebija od do?u Górna; Wste;ge; Bollingera */

///////     Kupno    ////////////
Buy = ( Cond1 AND Cond2 AND Cond2 ) OR Cond4 OR Cond5; ///  Kupno  ///

_SECTION_END();

_SECTION_BEGIN("Sprzedaj SAR");

///////Warunki Sprzedaz.y////////////
////////  Parabolic SAR - Sprzedaz. //////
Cond11 = SAR(SARfast, SARslow) > Close; /* Parabolic SAR jest > niz. Cena zamknie;cia */
_SECTION_END();

_SECTION_BEGIN(" 2_ Sprzedaj MACDspada ");
///////Warunki Sprzedaz.y////////////
Filter21 = Cross( Signal( 12, 26, 9 ), MACD( 12, 26 ) ); /* MACD przecia;? w dó? linie; Signal */
Filter22 = MACD( 12, 26 ) < Signal( 12, 26, 9 ); /* MACD jest mniejszy niz. Signal */
Filter23 = MACD( 12, 26 ) < Ref(MACD( 12, 26 ), -1 )*1.03; /* MACD spada */
Cond12 = Filter21 OR Filter22 AND Filter23; /* MACD jest mniejszy niz. Signal i Spada*/
_SECTION_END();

 _SECTION_BEGIN("3_S RSI przebija poz.70 ");
/////// Warunki Sprzedaz.y ////////////
//////// RSI przebija poziom 70 //////
Filter11 = Ref( RSI(), -2)  > 73 ; // przedwczoraj RSI > 73 //
Filter12 = Ref( RSI(), -1)  > 73 ; // wczoraj RSI > 73 //
Filter13 = Ref( RSI(), -1 ) - RSI() > 8 ; // RSI spada o 8 pkt. od przedwczoraj//
Filter14 = Cross( 70 ,  RSI()); // RSI przebija w dó? poz. 70 //

/////// Warunki sprzedaz.y ////////////
Sell1 = ( Filter11 OR Filter12 ) AND Filter13 ; // RSI >73 spada o 8 pkt. //
Sell2 = ( Filter11 OR Filter12 ) AND Filter14 ; // RSI >73 przebija w dó? poz. 70 //
Cond13 = Sell1 OR Sell2 ;

Sell = Cond11 OR Cond12 OR Cond13 ; // Sprzedaz. //
_SECTION_END();

_SECTION_BEGIN("Price");

// ColorClose = IIf( Buy, colorGreen, IIf( Sell, colorRed, colorBlue )); /* wybierz kolor */
ColorClose = IIf( Buy, colorDarkGreen, IIf( Sell, colorRed, colorBlue )); /* wybierz kolor */


SetChartOptions(0,chartShowArrows|chartShowDates);
_N(Title = StrFormat("{{NAME}} - {{DATE}} \n O %g, \n H %g, \n L %g, \n C %g   (%.1f%%) \n Vol " +WriteVal( V, 1.0 ) +" {{VALUES}}", O, H, L, C, SelectedValue( ROC( C, 1 )) ));
Plot( C, "Close", ColorClose , styleNoTitle | ParamStyle("Style") | GetPriceStyle() );
if( ParamToggle("Tooltip shows", "All Values|Only Prices" ) )
_SECTION_END();

_SECTION_BEGIN("Zmiany kursu"); // Wys'wietla zmiany kursu w kolorze
"Zmiana  = " + WriteVal( ROC( Close, 1 ) ) + " %" + "   (" + WriteVal( Close - Ref( Close, -1 ) ) + "  Z?) ";  /* Zm. dzienna */

// Zmiana =  WriteVal (Close - Ref( Close, -1 )) ; // Zm.od wczoraj
ZmProc = SelectedValue( ROC( C, 1 )) ; // Zmiana procentowa od wczoraj

GfxSetTextColor(IIf(ZmProc > 0, colorGreen,colorRed)); // Wybór koloru

// GfxTextOut("Zmiana = : " + Zmiana,0,30); // Zm.od wczoraj
GfxTextOut("                     " + ZmProc + "  %" ,200,00) ; // Zmiana procentowa od wczoraj
_SECTION_END();

_SECTION_BEGIN("EMA Kr."); // Rysuje; EMA(C,Krótka)  //
//  P = ParamField("Price field",-1);
PeriodsEMA13 = Param( "Periods  EMA ( 13 )", 13, 2, 20 );
EMArosnie = EMA( Close, PeriodsEMA13 ) > Ref( EMA( Close, PeriodsEMA13 ), -1 )*1.0 ; /* EMA ros'nie */
EMAspada = EMA( Close, PeriodsEMA13 ) < Ref( EMA( Close, PeriodsEMA13 ), -1 )*1.0 ;  /* EMA spada */
ColorEMA13 = IIf( EMArosnie, ParamColor("EMAros'nie", colorRed ), ParamColor("EMA spada", colorRed ) );
Plot( EMA( C, PeriodsEMA13 ), "\n " + _DEFAULT_NAME(), ColorEMA13, ParamStyle("Style") | styleThick );
_SECTION_END();


_SECTION_BEGIN("EMA S'r."); // Rysuje; EMA(C,S'rednia)  //
//  P = ParamField("Price field",-1);
PeriodsEMA55 = Param("Periods EMA ( 55 )", 55, 20, 60, 1 );
Plot( EMA( C, PeriodsEMA55 ), "\n " + _DEFAULT_NAME(), ParamColor( "Color", colorBlue ), ParamStyle("Style") | styleNoRescale | styleNoLabel);
_SECTION_END();

_SECTION_BEGIN("EMA D?."); // Rysuje; EMA(C,D?uga)  //
//  P = ParamField("Price field",-1);
PeriodsEMA90 = Param("Periods EMA ( 90 )", 90, 60, 90, 1 );
Plot( EMA( C, PeriodsEMA90 ), "\n " +_DEFAULT_NAME(), ParamColor( "Color", colorBlack ), ParamStyle("Style") | styleNoRescale | styleNoLabel);
_SECTION_END();

_SECTION_BEGIN("SAR");
acc = Param("Acceleration", 0.03, 0.01, 0.04, 0.01 );
accm = Param("Max. acceleration", 0.2, 0.1, 0.3, 0.1 );
ColorSAR = IIf( Buy, ParamColor("Up Color", colorGreen ), ParamColor("Down Color", colorRed ) );
Plot( SAR( acc, accm ), _DEFAULT_NAME(), ColorSAR, ParamStyle("Style", styleDots | styleNoTitle | styleNoLabel | styleNoLine, maskDefault | styleDots | styleNoLine ) );
_SECTION_END();

_SECTION_BEGIN("BBands");
Periods = Param("Periods", 15, 2, 100, 1 );
Width = Param("Width", 2, 0, 10, 0.05 );
Color = ParamColor("Color", colorBlack );
Style = ParamStyle("Style") | styleNoRescale | styleNoLabel | styleNoTitle;
Plot( bbt = BBandTop( Close, Periods, Width ), " " , Color, Style );
Plot( bbb = BBandBot( Close, Periods, Width ), " " , Color, Style );
PlotOHLC( bbt, bbt, bbb, bbb, "", ColorBlend( Color, colorWhite, 0.9 ), styleCloud | styleNoRescale, Null, Null, Null, -1 );
_SECTION_END();

_SECTION_BEGIN("Volume");
/////// S'rednia krocza;cawolumenu ///////
dni = Param(" dni (MA Volume) ", 25, 1, 50, 1 );
proc = Param(" proc (MA Volume) ", 2.5, 1.0, 5.0, 0.1);
Filter = Volume > MA( Volume, dni)* proc ; /* Wolumen > " dni " -dniowej s'redniej krocza;cej */
colVolume = IIf( Filter , ParamColor("Duz.y volumen", color = 11 ), ParamColor("Ma?y volumen", colorBlack ) );

Plot( Volume, _DEFAULT_NAME(), colVolume , styleNoTitle | ParamStyle( "Style", styleHistogram | styleOwnScale | styleNoLabel, maskHistogram  ), 2 );
_SECTION_END();

_SECTION_BEGIN("Wste;ga i strza?ki K/S");
showArrows = ParamToggle("Pokaz. strza?ki","Nie|Tak",1);
showRibbon = ParamToggle("Pokaz. wste;ge;","Nie|Tak",1);

//Short=Sell;
//Cover=Buy;
Buy = ExRem( Buy, Sell ); //Eliminacja powtórnych sygna?ów Buy przed nastepnym Sell
Sell = ExRem( Sell, Buy ); //Eliminacja powtórnych sygna?ów Sell przed nastepnym Buy

if (ShowRibbon) Plot(5, "ribbon", ColorClose, styleOwnScale|styleArea|styleNoLabel|styleNoTitle, -0.5,200);
//Plot(6, "", IIf(PDI(7) > MDI(7) AND PDI(7) > 30,colorGreen,IIf (MDI(7) > PDI(7) AND MDI(7) > 30,colorRed,colorYellow)), styleOwnScale| styleArea|styleNoLabel,-0.5,100);

shape = Buy * shapeUpArrow + Sell* shapeDownArrow;

if (ShowArrows) PlotShapes( shape, IIf( Buy, colorGreen, colorRed ), 0, IIf( Buy, Low, High));
_SECTION_END();

_SECTION_BEGIN("Statystyki");
"                   " + Name() ;
"Zmiana  = " + WriteVal( ROC( Close, 1 ) ) + " %" + "   (" + WriteVal( Close - Ref( Close, -1 ) ) + "  Z?) ";  /* Zm. dzienna */
"  Close   = " + WriteVal( Close );  /* Close dzisiaj */
"     EMA  = " + WriteVal( EMA( Close, 13 ) );  /* EMA dzisiaj */
"C / EMA  = " + ((( Close ) - EMA( Close, 13 )) * 100) / EMA( Close, 13 ) + " %";  /* Close / EMA */
"          ";

"Tydzien' = " + WriteVal( ROC( Close, 5 ) ) + " %" + "   (" + WriteVal( Close - Ref( Close, -5 ) ) + "  Z?) ";  /* Zm. tygodniowa */
"Miesia;c = " + WriteVal( ROC( Close, 20 ) ) + " %" + "   (" + WriteVal( Close - Ref( Close, -20 ) ) + "  Z?) ";  /* Zm. miesie;czna */
"          ";
"Close    [ - tydzien' ]   = " + WriteVal( Ref( Close, -5 ) ); /* Close - tydzien' wczes'niej */
"Close    [ - miesia;c ]   = " + WriteVal( Ref( Close, -20 ) ); /* Close Miesia;c */
_SECTION_END();

_SECTION_BEGIN("Price Interpretation");
movshort = ParamField("Short Time MA", 8 );
movmed = ParamField("Mid Time MA", 9 );
movlong = ParamField("Long Time MA", 10 );
btop = ParamField("BBTop", 11 );
bbot = ParamField("BBBottom", 12 );
if( Status("action") == actionCommentary )
{
width = btop - bbot;
lslop = LinRegSlope( C, 30 ) + 100;
lslo = LLV( lslop, 90 );
lshi = HHV( lslop, 90 );
lswidth = lshi - lslo;
trend = 100*( lslop - lslo )/lswidth;

mawidth = MA( width, 100 );
relwidth = 100*(width - mawidth)/mawidth;

_N( tname = Name()+"("+FullName()+")" );

printf("Price and moving averages:\n");
printf( tname + " has closed " + WriteIf( C > movshort, "above" , "below" ) + " its Short time moving average. ");

printf("\nShort time moving average is currently " + WriteIf( movshort > movmed, "above", "below") + " mid-time, AND " + WriteIf( movshort > movlong, "above", "below" ) + " long time moving averages.");

printf("\nThe relationship between price and moving averages is: "+
WriteIf( C > movshort AND movshort > movmed, "bullish",
WriteIf( C < movshort AND movshort < movmed, "bearish", "neutral" ) ) + " in short-term, and "+
WriteIf( movshort > movmed AND movmed > movlong , "bullish",
WriteIf( movshort < movmed AND movmed < movlong, "bearish", "neutral" ) ) + " in mid-long term. ");

printf("\n\nBollinger Bands:\n");
printf(tname+ " has closed " +
WriteIf( C < bbot, "below the lower band by " +
WriteVal( 100 *( bbot-C )/ width, 1.1 ) + "%%. " +
WriteIf( trend < 30, " This combined with the steep downtrend can suggest that the downward trend in prices has a good chance of continuing.  However, a short-term pull-back inside the bands is likely.",
WriteIf( trend > 30 AND trend < 70, "Although prices have broken the lower band and a downside breakout is possible, the most likely scenario for "+tname+" is to continue within current trading range.", "" ) ), "" ) +

WriteIf( C > btop, "above the upper band by " +
WriteVal( 100 *( C- btop )/ width, 1.1 ) + "%%. " +
WriteIf( trend > 70, " This combined with the steep uptrend suggests that the upward trend in prices has a good chance of continuing.  However, a short-term pull-back inside the bands is likely.",
WriteIf( trend > 30 AND trend < 70, "Although prices have broken the upper band and a upside breakout is possible, the most likely scenario for "+tname+" is to continue within current trading range.", "" ) ), "" ) +

WriteIf( C < btop AND ( ( btop - C ) / width ) < 0.5,
"below upper band by " +
WriteVal( 100 *( btop - C )/ width, 1.1 ) + "%%. ",
WriteIf( C < btop AND C > bbot , "above bottom band by " +
WriteVal( 100 *( C - bbot )/ width, 1.1 ) + "%%. ", "" ) ));

printf("\n"+
WriteIf( ( trend > 30 AND trend < 70 AND ( C > btop OR C < bbot ) ) AND abs(relwidth) > 40,
		 "This picture becomes somewhat unclear due to the fact that Bollinger Bands are  currently",
		 "Bollinger Bands are " )+
WriteVal( abs( relwidth ), 1.1 ) + "%% " +
WriteIf( relwidth > 0, "wider" , "narrower" ) +
" than normal.");

printf("\n");

printf(
WriteIf( abs( relwidth ) < 40, "The current width of the bands (alone) does not suggest anything conclusive about the future volatility or movement of prices.","")+
WriteIf( relwidth < -40, "The narrow width of the bands suggests low volatility as compared to " + tname + "'s normal range.  Therefore, the probability of volatility increasing with a sharp price move has increased for the near-term. "+
"The bands have been in this narrow range for " + WriteVal(BarsSince(Cross(-40,relwidth)),1.0) + " bars. The probability of a significant price move increases the longer the bands remain in this narrow range." ,"")+
WriteIf( relwidth > 40, "The large width of the bands suggest high volatility as compared to " + tname + "'s normal range.  Therefore, the probability of volatility decreasing and prices entering (or remaining in) a trading range has increased for the near-term. "+
"The bands have been in this wide range for  " + WriteVal(BarsSince(Cross(relwidth,40)),1.0) + " bars.The probability of prices consolidating into a less volatile trading range increases the longer the bands remain in this wide range." ,""));

printf("\n\nThis commentary is not a recommendation to buy or sell. Use at your own risk.");
}
_SECTION_END();
2 comments
Leave Comment
Please login here to leave a comment.
Thanks i will test and let u know the results.
it is the exact copy of guppy trend