Detrended Price Oscillator System for Amibroker (AFL)
anandnst about 14 years ago Amibroker (AFL)
a new trade is caculated from the open of next day, since the signals arrive after trading
3.0% stoploss
2.5% profitstop
3.5% trailingstop
all trades are closed instantly on hit
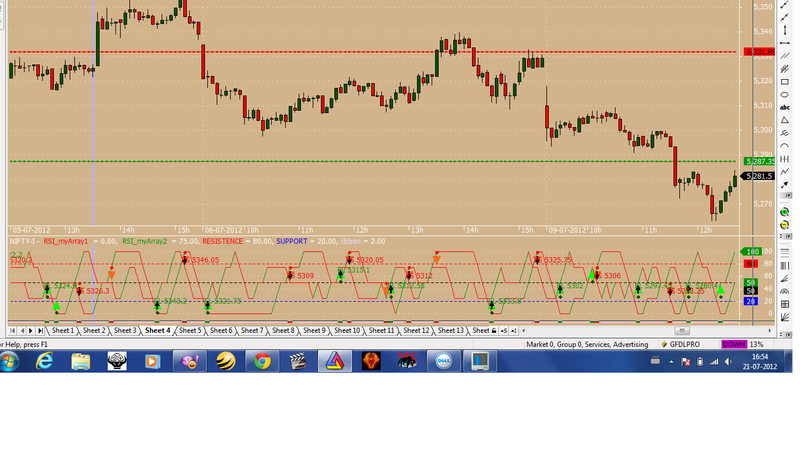
showed first pic, is december 2011 till now, made about 23 points, each 200 euro each when trading futures.
2nd is points grow ( not equity)
the system refers on a periodes-value, and pds-value.
both are set to 1
Now we have 511 trades since 2000, with a winratio of 57.34%
Entty criteria is still simple, a cross of lines means action!
Screenshots
Indicator / Formula
Copy & Paste Friendly
_SECTION_BEGIN("DetrendedPriceOsc_System");

Hc=(O+H+L+O)/4; // CLOSE REPLACED BY OPEN
Ho = AMA( Ref( Hc, -1 ), 0.5 );
pds = Optimize("pds ",Param("pds ",1,1,14,1),1,14,1);//4
period = Optimize("period ",Param("period ",1,1,14,1),1,14,1);


function DetrendedPriceOsc( Periods )
{
return Hc - AMA(Ref( MA( Hc, Periods ), -( 1 + Periods/2 ) ),0.5);
}

myArray1 = ( RSIa( DetrendedPriceOsc( period ),pds ) + Ref(RSIa(DetrendedPriceOsc( period ),pds),-1) + Ref(RSIa(DetrendedPriceOsc( period ),pds),-2) +Ref(RSIa(DetrendedPriceOsc( period ),pds),-3))/4 ;
myArray2 = ( RSIa( Ho,pds )+ Ref(RSIa( Ho,pds ),-1) +Ref(RSIa( Ho,pds ),-2) + Ref(RSIa(Ho,pds),-3))/4 ;


Plot( myArray1 , " RSI_myArray1 ", IIf( myArray1 >Ref(myArray1 ,-1), colorGreen, colorRed ));
Plot( myArray2 , " RSI_myArray2 ", IIf( myArray2 >Ref(myArray2 ,-1), colorGreen, colorRed ));

Plot(80,"RESISTENCE",colorRed, styleLine|styleDashed | styleThick);
Plot(50,"",colorBlack, styleLine|styleDashed | styleThick);
Plot(20,"SUPPORT",colorBlue, styleLine|styleDashed | styleThick);

Buy=Cover=Cross(myarray1,myarray2) ;
Short=Sell=Cross(myarray2,myarray1) ;

Plot ( 2, "", IIf( Buy , colorGreen, IIf( Short, colorRed, colorPink )), styleOwnScale|styleArea|styleNoLabel, -0.5, 100 );

ExRem(Buy,Sell);
ExRem(Short,Cover);

PlotShapes( Buy * shapeUpTriangle, colorBrightGreen, 0);
PlotShapes( Short * shapeDownTriangle, colorOrange, 0);
PlotShapes( Sell * shapeSmallCircle, colorRed, 0,myarray1,Offset=25);
PlotShapes( Cover * shapeSmallCircle, colorDarkGreen, 0,myarray1,Offset=-25);

ApplyStop(stopTypeLoss, stopModePercent, Optimize( "stopTypeLoss", 3.0, 2.5, 2.5, 0.5 ) ,1, True );
ApplyStop(stopTypeProfit , stopModePercent, Optimize( "stopTypeProfit ", 2.5, 2.5, 2.5, 0.5 ) ,1, True );
ApplyStop(stopTypeTrailing , stopModePercent, Optimize( "stopTypeProfit ", 3.5, 2.5, 2.5, 0.5 ) ,1, True );

// change the questionmarks the the value which is used to plot the indicator
base_array=myarray1;

////////////////////////////// HIGHLY IMPORTANT ////////////////////

//ACTIVATE STOPS IN SETTINGS
e = Equity(1,0); /* Highly Important!!. "Removes all extra signals, evaluates
stops AND writes BACK signals to Sell/Cover arrays". As it should be!!*/

PlotShapes( Buy* shapeUpArrow , colorBlack, 0);
PlotShapes( Short* shapeDownArrow , colorBlack, 0);

/*
1 - regular exit
2 - Max. loss
3 - profit target
4 - trailing
5 - ruin stop
6 - n-bar stop
*/

PlotShapes(IIf(Ref(Cover==2,-1), shapeCircle, shapeNone),colorRed,0,base_array,0); //stoploss
PlotShapes(IIf(Ref(Cover==3,-1), shapeCircle, shapeNone),colorGreen,0,base_array,0); //profit target

PlotShapes(IIf(Ref(Sell==2,-1), shapeCircle, shapeNone),colorRed,0,base_array,0); //stoploss
PlotShapes(IIf(Ref(Sell==3,-1), shapeCircle, shapeNone),colorGreen,0,base_array,0); //profit target

////////////////////////////////////////////////////////////////////////////////
OffsetBuy = Param("Offset_Buy (green)", -9, -25, 25, 1 );
OffsetSell = Param("Offset_Sell (blue)", 2, -25, 25, 1 );
OffsetShort = Param("Offset_Short (red)", 7, -25, 25, 1 );
OffsetCover = Param("Offset_Cover (orange)", -4, -25, 25, 1 );

OND=Ref(O,1); //OPEN NEXT DAY
base_arrayBUY=base_array+OffsetBuy ; //just for offset
base_arraySELL=base_array+OffsetSell ; //just for offset
base_arraySHORT=base_array+OffsetShort ; //just for offset
base_arrayCOVER=base_array+OffsetCover ; //just for offset

for( i = 0; i < BarCount; i++ )
{
if( Buy[i] ) PlotText( "EL " + OND[ i ], i, base_arrayBUY[ i ], colorGreen );
if( Sell[i] AND NOT Short[i] ) PlotText( "LE " + OND[ i ], i, base_arraySELL[ i ], colorBlue);
if( Short[i] ) PlotText( "ES " + OND[ i ], i, base_arraySHORT[ i ], colorRed);
if( Cover[i] AND NOT Buy[i] ) PlotText( "SE " + OND[ i ], i, base_arrayCOVER[ i ], colorOrange);
}
_SECTION_END();

_SECTION_BEGIN("trending ribbon");
GraphXSpace=15;
uptrend=Buy;
downtrend=Short;
Plot( 2, "ribbon",IIf( uptrend, colorGreen, IIf( downtrend, colorRed, colorLavender )), styleOwnScale|styleArea|styleNoLabel, -0.5, 100 );
_SECTION_END();
3 comments
Leave Comment
Please login here to leave a comment.
Nice copy paste…..!
original:
http://www.traderji.com/amibroker/68546-detrendedpriceosc_system.html
thanx for surfing the net and sharing ur searches….
by the way system is good.
Hello Extremist,
My Aim is to help all who are visiting this website.
If u have any problem u can also surf n post the afls in this website.
Look for the good work .. Dont criticize if u cant do it.
Thnx you
Reality bites…..!
Any ways i didn’t mean to heart u or u r feelings.
i already appreciated ur work of surfing and sharing.
My Point was " Just give credits to those who has really taken the hard work"
And for me – i can code my own ideas. even i shared those.
i didn’t forced anybody. i can’t.
i just shared MY OWN idea there…
any ways sorry if i heart u
thanx….