CCT CMO trading system for Amibroker (AFL)
overdrunk almost 16 years ago Amibroker (AFL)
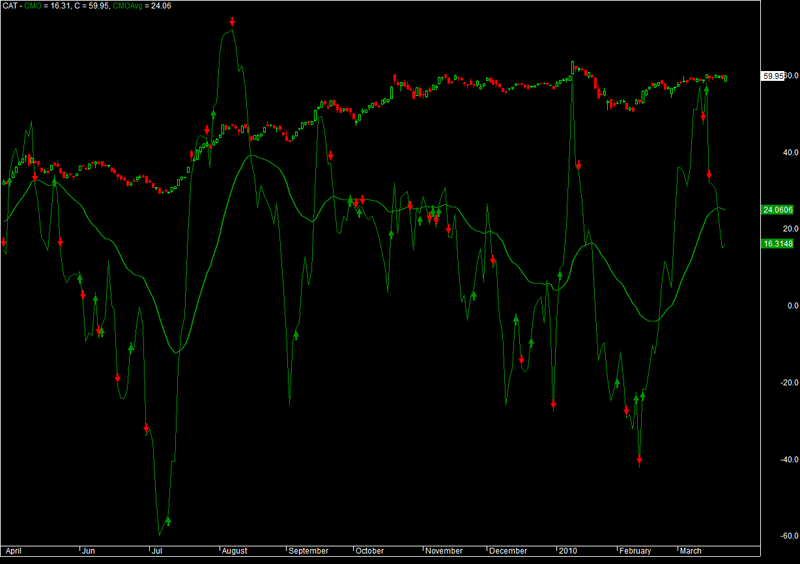
I got this formula from book “quantitative trading systems”, and the author backtested this formula and got about ~10% return from the market annually.
Screenshots
Indicator / Formula
Copy & Paste Friendly
CMOperiods=Optimize("pds",Param("CMO periods",21,2,100,2),2,100,2);
//CMOperiods=20;
AMAAvg=Optimize("AMA Avg",Param("AMA Avg",50,2,100,2),2,100,2);
//AMAAvg=40;
//trgAvg=Optimize("Trg Avg",Param("trigger Avg",3,2,20,1),2,20,1);
trgAvg=3;

SumUp=Sum(IIf(C>Ref(C,-1),(C-Ref(C,-1)),0), CMOperiods);
SumDn=Sum(IIf(C<Ref(C,-1),(Ref(C,-1)-C),0), CMOperiods);

CMO=100*(SumUp-SumDn)/(SumUp+SumDn);
Plot(CMO,"CMO",colorGreen,styleLine);

CMOAvg=DEMA(CMO,AMAAvg);
trigger=DEMA(CMOAvg,trgAvg);
Buy=Cross(CMOAvg,trigger);
Sell=Cross(trigger,CMOAvg) OR BarsSince(Buy)>=50;

Buy=ExRem(Buy,Sell);
Sell=ExRem(Sell,Buy);

Short=Cross(trigger,CMOAvg);
Cover=Cross(CMOAvg,trigger) OR BarsSince(Short)>=50;

Plot(C,"C",colorWhite,styleCandle);
PlotShapes(Buy*shapeUpArrow+Sell*shapeDownArrow,IIf(Buy,colorGreen,colorRed));
Plot(CMOAvg,"CMOAvg",colorGreen,style=styleLine|styleOwnScale|styleThick,-100,100);
0 comments
Leave Comment
Please login here to leave a comment.