5-34 oscilator for Amibroker (AFL)
Gorilabd almost 16 years ago Amibroker (AFL)
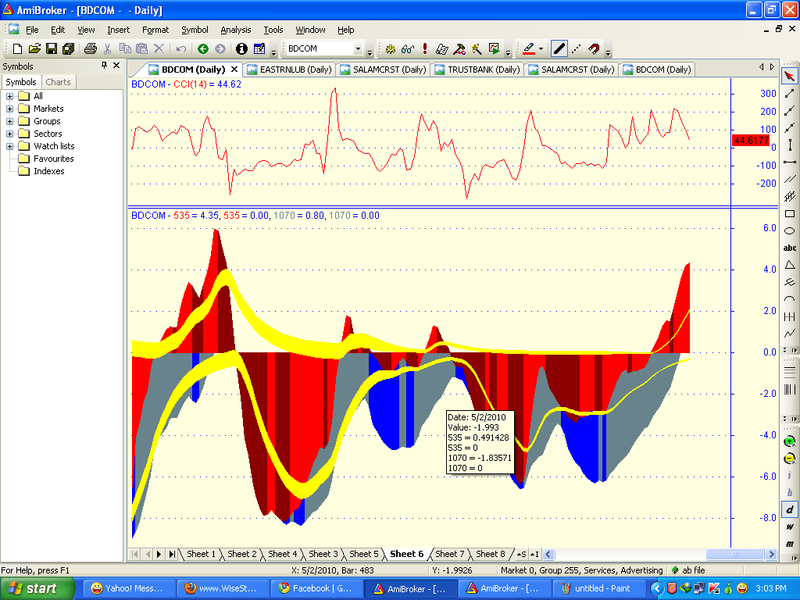
Follow the colors and Zero line….when it crosses zero line and go upward then it is a buy signal and if the crossover is negative then it is a sell signal….and when there is a blue shade entry is risky….u have to wait until the blue shade gone and the black shade comes to give an entry…..
Screenshots
Indicator / Formula
Copy & Paste Friendly
_SECTION_BEGIN("5-35 OSCILLATOR");
A2 = MA(C,5);
B2 = MA(C,35);
D2 = A2-B2;


XPLUS=IIf(D2>0,D2,0);
XMINUS=IIf(D2<0,D2,0);


PD=periods = Param( "Periods", 15, 1, 200, 1 );

Y=EMA(XPLUS,PD);
Z=EMA(XMINUS,PD);

DIFF=Param( "DIFF", 0.02, 0.01, 10, 1 );

YP=Y+HHV(Y,100)*DIFF;
YM=Y-HHV(Y,100)*DIFF;


ZP=Z+HHV(Y,100)*DIFF;
ZM=Z-HHV(Y,100)*DIFF;


PlotOHLC( YP, YP, YM , YM , "",colorYellow, styleCloud | styleNoLabel);
PlotOHLC( ZP, ZP, ZM , ZM , "",colorYellow, styleCloud | styleNoLabel);


Colorm=IIf(D2>Ref(D2,-1),colorRed,colorDarkRed);
Plot( D2, "535", Colorm, styleHistogram|styleNoLabel );
PlotOHLC( 0, D2, 0 , 0 , "535",Colorm, styleCloud | styleNoLabel);


//////////////////////////////////////////////////////////////////////////////////////
/////////////////////////////////////////////////////////////////////////////////
A3 = MA(C,10);
B3 = MA(C,70);
D3 = A3-B3;


Colorm=IIf(D3>Ref(D3,-1),colorPaleBlue,colorBlue);
Plot( D3, "1070", Colorm, styleHistogram|styleNoLabel );


PlotOHLC( 0, D3, 0 , 0 , "1070",Colorm, styleCloud | styleNoLabel);


_SECTION_END();
1 comments
Leave Comment
Please login here to leave a comment.
probably inspired from Woodie CCI