Percentage Price Oscillator - PPO for Amibroker (AFL)
leedat almost 16 years ago Amibroker (AFL)
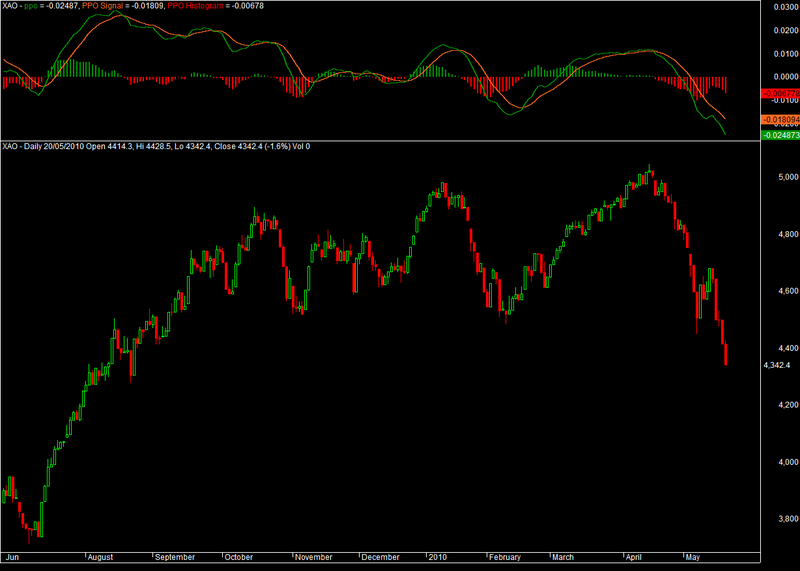
Percentage Price Oscillator – PPO
What Does Percentage Price Oscillator – PPO Mean?
A technical momentum indicator showing the relationship between two moving averages. To calculate the PPO, subtract the 26-day exponential moving average (EMA) from the nine-day EMA, and then divide this difference by the 26-day EMA. The end result is a percentage that tells the trader where the short-term average is relative to the longer-term average.
Calculated as:
Investopedia explains Percentage Price Oscillator – PPO
The PPO and the moving average convergence divergence (MACD) are both momentum indicators that measure the difference between the 26-day and the nine-day exponential moving averages. The main difference between these indicators is that the MACD reports the simple difference between the exponential moving averages, whereas the PPO expresses this difference as a percentage. This allows a trader to use the PPO indicator to compare stocks with different prices more easily. For example, regardless of the stock’s price, a PPO result of 10 means the short-term average is 10% above the long-term average.
Source: http://www.investopedia.com/terms/p/ppo.asp
Screenshots
Indicator / Formula
_SECTION_BEGIN("PPO");
//Further understanding of PPO indicator visit www.Stockchart.com
PPOShort = Param("PPO Short Period", 12, 1, 150, 1);
PPOLong = Param("PPO Long Period", 26, 1, 150, 1);
PPOsignal = Param("PPOsignal", 9, 1, 150, 1);
PPO = (EMA(C, PPOShort ) - EMA(C, PPOLong ))/ EMA(C, PPOLong );
PPOS = (EMA(ppo, PPOsignal ));
Val=ppo-PPOS ;
Plot( PPO , "ppo", colorGreen, styleLine| styleThick );
Plot ( PPOS ,"PPO Signal", colorOrange, styleLine| styleThick );
dynamic_color = IIf( Val> 0, colorGreen, colorRed );
Plot( Val, "PPO Histogram", dynamic_color, styleHistogram | styleThick );
Buy=cross(PPO,PPOS);
Sell=cross(PPOS,PPO);
_SECTION_END();
2 comments
Leave Comment
Please login here to leave a comment.
Looks same as PPO for KAMAS
http://wisestocktrader.com/indicators/255-ppo-for-kamas-system
and Percentage price ocillator pasted here before
Yeah it’s similar but it has an excellent description so I’ll leave it.