Stop Loss Indicator for Amibroker (AFL)
kaiji almost 16 years ago Amibroker (AFL)
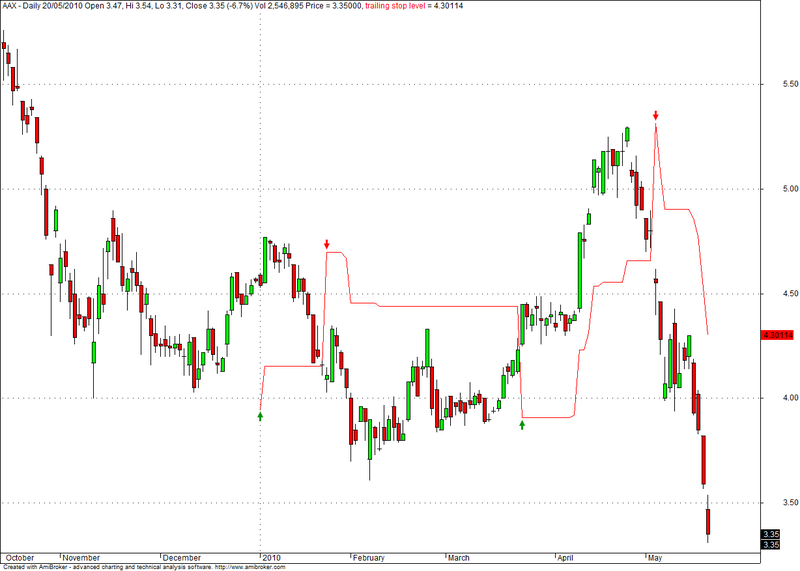
Includes 3 different stop losses in the one indicator: Fixed, Chandelier and Modified ATR. To use it you just need to change the starting date to when you entered your trade and the stop loss will be plotted.
Source: Here
Screenshots
Indicator / Formula
Copy & Paste Friendly
Version( 5.20 ); // requires v5.20
SetBarsRequired( sbrAll );

// get start date
Start = Cross( DateNum(), ParamDate( "Start date", "2005-10-30" ) );
Started = Flip( Start, 0 );

StopMode = ParamList( "Stop Mode", "Fixed|Chandelier|Modified ATR" );
StopLevel = Param( "Fixed perc %", 14, 0.1, 50, 0.1 ) / 100;
StopATRFactor = Param( "ATR multiple", 4, 0.5, 10, 0.1 );
StopATRPeriod = Param( "ATR period", 14, 3, 50 );

// calculate support and resistance levels
if ( StopMode == "Fixed" ) // fixed percent trailing stop
{
    sup = C * ( 1 - stoplevel );
    res = C * ( 1 + stoplevel );
}
else
{
	// Chandelier ATR-based stop
    if ( StopMode == "Chandelier" )
    {
        sup = C - StopATRFactor * ATR( StopATRPeriod );
        res = C + StopATRFactor * ATR( StopATRPeriod );
    }
    else
    {
        HL = H - L;
        MAHL = 1.5 * MA( HL, StopATRPeriod );
        HiLo = IIf( HL < MAHL, HL, MAHL );
        H1 = Ref( H, -1 );
        L1 = Ref( L, -1 );
        C1 = Ref( C, -1 );
        Href = IIf( L <= H1, H - C1, ( H - C1 ) - ( L - H1 ) / 2 );
        Lref = IIf( H >= L1, C1 - L, ( C1 - L ) - ( L1 - H ) / 2 );

        diff1 = Max( HiLo, HRef );
        diff2 = Max( diff1, LRef );

        ATRmod = Wilders( diff2, StopATRPeriod );

        sup = C - StopATRFactor * ATRmod ;
        res = C + StopATRFactor * ATRmod ;
    }
}

// calculate trailing stop line
trailARRAY = Null;

trailstop = 0;

for ( i = 1; i < BarCount; i++ )
{
    if ( Started[ i ] == 0 )
        continue;

    if ( C[ i ] > trailstop AND C[ i - 1 ] > trailstop )
        trailstop = Max( trailstop, sup[ i ] );
    else
        if ( C[ i ] < trailstop AND C[ i - 1 ] < trailstop )
            trailstop = Min( trailstop, res[ i ] );
        else
            trailstop = IIf( C[ i ] > trailstop, sup[ i ], res[ i ] );

    trailARRAY[ i ] = trailstop;
}

// generate buy/sell signals based on crossover with trail stop line
Buy = Start OR Cross( C, trailArray );
Sell = Cross( trailArray, C );

PlotShapes( Buy*shapeUpArrow, colorGreen, 0, trailarray );
PlotShapes( Sell*shapeDownArrow, colorRed, 0, trailarray );

Plot( Close, "Price", colorBlack, styleBar );
//SetBarFillColor( colorYellow );
Plot( trailARRAY, "trailing stop level", colorRed, styleLine );
5 comments
Leave Comment
Please login here to leave a comment.
Hi Admin,
I am only getting proce bars – no stop loss line even after changing the date.
Plaese advise.
Thanks
Amruta
Hello did you change the parameters to the correct starting date and picked a trailing stop loss like chandelier?
screenshot and afl is diffrant
Hello worldastro, that screen-shot was made using this formula. You need to adjust the parameters that’s all.
dear sir how can i convert this formula in gci or broker trader ,plz help me