Jim Berg Stop Loss for Amibroker (AFL)
siivaramm almost 16 years ago Amibroker (AFL)
In “The Truth About Volatility,” Jim Berg presents how to use several well-known volatility measures such as average True range (ATR) to calculate entry, trailing stop, AND profit-taking levels. Implementing techniques presented in the article is very simple using the AmiBroker Formula Language (Afl), AND takes just a few lines of code.
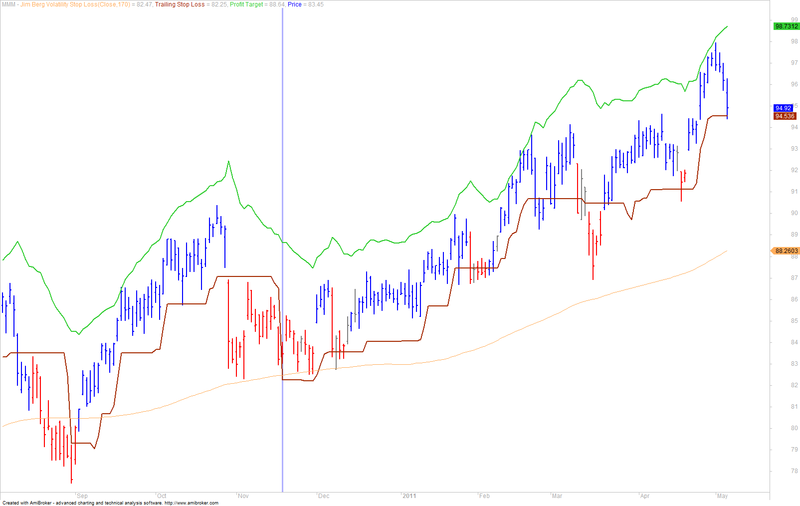
Listing 1 shows the formula that the plots color-coded price chart, trailing stop, AND profit-taking lines, as well as a colored ribbon showing volatility-based entry AND exit signals. The relative strength index (RSI) used by Berg is a built-in indicator in AmiBroker, so no additional code is necessary. See Figure 3 for an example.
Screenshots
Indicator / Formula
_SECTION_BEGIN("Jim Berg Volatility Stop Loss");
P = ParamField("Price field",-1);
Periods = Param("Periods", 170, 2, 200, 1 );
Plot( MA( P, Periods ), _DEFAULT_NAME(), ParamColor( "Color", colorCycle ), ParamStyle("Style") );

TwoAtr =  2 * ATR( 10 );
EntrySignal = C > ( LLV( L, 20 ) + TwoAtr);
ExitSignal = C < ( HHV( H, 20 ) - TwoAtr);
TrailingStop = HHV( C - TwoAtr, 15 );
ProfitTarget = EMA( H, 13 ) + TwoAtr;

Plot( TrailingStop, "Trailing Stop Loss", colorBrown, styleThick | styleLine );
Plot( ProfitTarget, "Profit Target", colorLime, styleThick );
Plot( C, "Price", IIf( EntrySignal, colorBlue, IIf( ExitSignal, colorRed, colorGrey50 )), styleBar | styleThick );

Buy = EntrySignal;
Sell = ExitSignal or Cross(TrailingStop, C) OR Cross(C, ProfitTarget);

_SECTION_END();
2 comments
Leave Comment
Please login here to leave a comment.
Very good.
Please add aslo Buy sell signals if possible
thanks
viswanath
Can you add Buy and Sell signal’s please?
Thanks!!