STOCH COLORED for Amibroker (AFL)
mmanoj almost 16 years ago Amibroker (AFL)
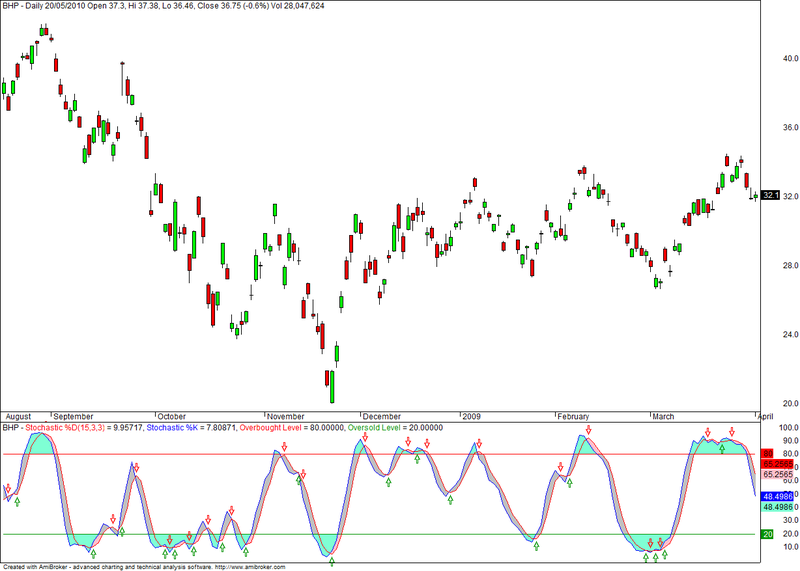
This Indicator shows Stochastics in Color form
So that it would become easy to identify the most
Overbought and Oversold Zone
Screenshots
Indicator / Formula
Copy & Paste Friendly
_SECTION_BEGIN("Stochastic");

periods = Param( "Periods", 15, 1, 200, 1 );
Ksmooth = Param( "%K avg", 3, 1, 200, 1 );
Dsmooth = Param( "%D avg", 3, 1, 200, 1 );
myStochD=StochD( periods , Ksmooth, DSmooth );
myStochK=StochK( periods , Ksmooth);
Overbought=80;
Oversold=20;

Buy = Cross(myStochK, myStochD );
Sell = Cross( myStochD, myStochK );

Plot( myStochD, "Stochastic %D"+_PARAM_VALUES(), ParamColor( "ColorD", colorRed ), ParamStyle("StyleD") );
Plot( myStochK, "Stochastic %K", ParamColor( "ColorK", colorBlue ), ParamStyle("StyleK") );

PlotShapes(IIf(Sell, shapeHollowDownArrow , shapeNone), colorRed);
PlotShapes(IIf(Buy, shapeHollowUpArrow , shapeNone), colorGreen);

Plot(Overbought,"Overbought Level",colorRed);
Plot(Oversold,"Oversold Level",colorGreen);


PlotOHLC( myStochK,myStochK,50,myStochK, "", colorAqua, styleCloud | styleClipMinMax, 20, 80 );
PlotOHLC( myStochD,myStochD,50,myStochD, "", colorPink, styleCloud | styleClipMinMax, 20, 80 );

PlotOHLC( Null,myStochD,myStochK,Null, "", colorLightGrey, styleCloud);


_SECTION_END();
0 comments
Leave Comment
Please login here to leave a comment.