ABKPPowerPops for Amibroker (AFL)
rajbhagalpur almost 16 years ago Amibroker (AFL)
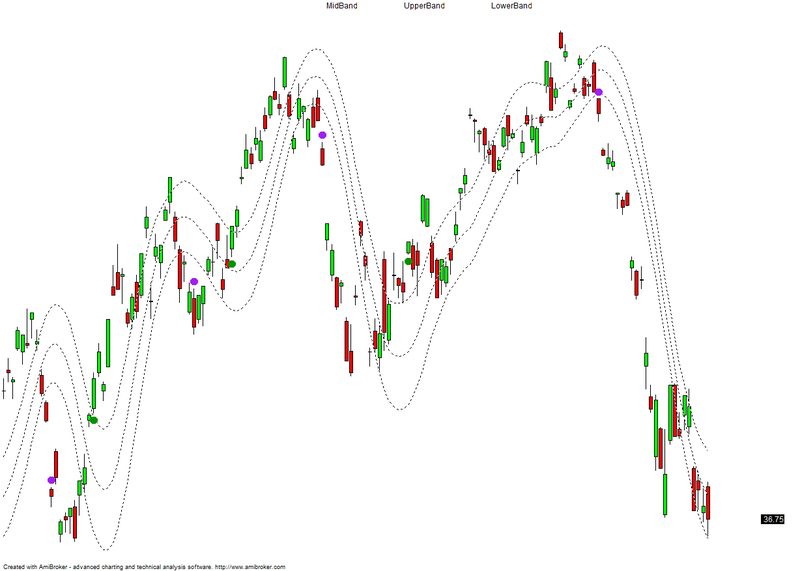
In any event, these are the elements needed for the new POWER POP dot.
BUY DOT placed below the bar once only. A new dot can only appear when we get an opposite configuration.
1) Triggosc is >0
2) Triggerline is >= Stopline
3) Scorecard is >5
4) Medium is > Medium MA
5) Shorttermtradebias > 0
6) Close is> 18 period Standard error plot. This one is the tricky one because the settings I’m using are 18 periods of the close and a smoothing average of 9 periods. I’m not sure how you can reference that value.
Naturally a sell dot would be just the opposite
Needs foundation plugin installed.
Screenshots
Indicator / Formula
/* ABKPPowerPops
	In any event, these are the elements needed for the new POWER POP dot.
	BUY DOT placed below the bar once only. A new dot can only appear when we get an opposite configuration.
		1) Triggosc is >0
		2) Triggerline is >= Stopline
		3) Scorecard is >5
		4) Medium is > Medium MA
		5) Shorttermtradebias > 0
		6) Close is> 18 period Standard error plot. This one is the tricky one because the settings I'm using are 18 periods of the close and a smoothing average of 9 periods. I'm not sure how you can reference that value.

Naturally a sell dot would be just the opposite.

*/

parmPPUpColor = ParamColor("Power Pops up color", colorGreen);
parmPPDnColor = ParamColor("Power Pops dn color", ColorRGB(160, 32, 240));
parmBand = ParamList("Use SEBand", "Upper/Lower|Middle", 0);
parmDetrendPeriod = Param("Detrend period", 8, 1, 20, 1);
parmPlotEBand = ParamToggle("Plot mini-SEBand", "No|Yes", 1);
parmSEBandPeriod = Param("mini-SEBand period", 18, 2, 20, 1);
parmSEBandSmooth = Param("mini-SEBand smooth period", 9, 1, 20, 1);
parmMBColor = ParamColor("mini-SEBand MB color",colorBlack);
parmMBStyle = ParamStyle("mini-SEBand MB Style", style=styleDashed | styleNoLabel, Mask=maskAll );
parmUBColor = ParamColor("mini-SEBand MB Color",colorBlack);
parmUBStyle = ParamStyle("mini-SEBand MB Style", style=styleLine | styleNoLabel, Mask=maskAll );
parmLBColor = ParamColor("mini-SEBand MB Color",colorBlack);
parmLBStyle = ParamStyle("mini-SEBand MB Style", style=styleLine | styleNoLabel, Mask=maskAll );
parmPlotTargets = ParamToggle("Plot stop", "No|Yes", 0);
parmTargetColor = ParamColor("Stop color", colorDarkRed);
parmTargetStyle = ParamStyle("Stop style", styleSwingDots, maskAll);
parmPlotRibbon = ParamToggle("Plot as ribbon", "No|Yes", 0);
parmRibbonSize = Param("Ribbon Size", 1, 0.5, 10, 0.5);
ParmSCThreshold = Param("ScoreCard Threshold", 5, 1, 9, 1);
parmVoice = ParamToggle("Voice", "No|Yes", 0);
parmDebug = ParamToggle("Debug", "No|Yes", 0);
SetBarsRequired(350, -1);
// constants
_N(CPaneName = Name() + Interval(2) + _SECTION_NAME());
_N(CNewBarName = "NewBar" + CPaneName);

//functions
function CNewBar()
{
	PrevDT = StaticVarGet( CNewBarName);
	DT = LastValue(DateTime());
	StaticVarSet( CNewBarName,DT);
	return DT != PrevDT;
}
function MRoundB(Number, Multiple )
{
	if(Multiple == 0 )
	{

		xMultiple = 0.01;	}
	else
	{
	xMultiple = Multiple;
	}
	Divided = Number / xMultiple;
	intDivided = int(Divided);
	intDivided = intDivided + round(Divided - intDivided);
	return intDivided * xMultiple;
}

ObjAB = CreateObject("Broker.Application");
ticker = objAB.Stocks(Name() );
NewBarSignal = CNewBar();

//KP indicators
sw = E_TSKPUPSELL(Open,High,Low,Close,Volume);
KPTriggerLine = tskp_triggerline;
dummya = E_TSKPMEDIUM(Close);
KPMediumUp = tskp_mediumup;
KPMediumDn = tskp_mediumdown;
KPMediumMA = tskp_mediumma;
Ctmpl = E_TSKPCOLORTMPL(Open,High,Low,Close,Volume);	//ScoreCard
KPScoreCard = 0;
KPScoreCard = KPScoreCard  + IIf(tskp_colortmplcnd0 > 0, 1, -1);
KPScoreCard = KPScoreCard  + IIf(tskp_colortmplcnd1 > 0, 1, -1);
KPScoreCard = KPScoreCard  + IIf(tskp_colortmplcnd2 > 0, 1, -1);
KPScoreCard = KPScoreCard  + IIf(tskp_colortmplcnd3 > 0, 1, -1);
KPScoreCard = KPScoreCard  + IIf(tskp_colortmplcnd4 > 0, 1, -1);
KPScoreCard = KPScoreCard  + IIf(tskp_colortmplcnd5 > 0, 1, -1);
KPScoreCard = KPScoreCard  + IIf(tskp_colortmplcnd6 > 0, 1, -1);
KPScoreCard = KPScoreCard  + IIf(tskp_colortmplcnd7 > 0, 1, -1);
KPScoreCard = KPScoreCard  + IIf(tskp_colortmplcnd8 > 0, 1, -1);
KPStopLine = E_TSKPSTOPLINE(High,Low,Close);
dummy = E_TSKPSHORTTERMTRADEBIAS(High,Low,Close);
KPSTTB = tskp_sttb1;

if(parmDebug == 1)
	{
	printf("KBTriggerLine: %g%\nKPSTTB: %g%\nKPMediumUp: %g%\nKPMediumDn: %g%\nKPMediumMa: %g%\nScoreCard: %f1.0%\nStopLine: %g%", KPTriggerLine, KPSTTB, KPMediumUp, KPMediumDn, KPMediumMa, KPScoreCard, KPStopLine);
	}
// calculations
//Detrend = KPTriggerLine - MA(KPTriggerLine, parmDetrendPeriod);	//Detrend KPTriggerLine
TriggOsc = C - Ref( MA( C, parmDetrendPeriod ), -( 1 + parmDetrendPeriod/2 ) );
LRCurve = LinearReg( C, parmSEBandPeriod );
MALRCurve  = MA(LRCurve, parmSEBandSmooth);
SEValue = StdErr( C, parmSEBandPeriod );
SErrorAvg =  MA(SEValue, parmSEBandSmooth);
LowerBand = MALRCurve - SErrorAvg ;
UpperBand = MALRCurve + SErrorAvg ;
if(parmBand == "Upper/Lower")
	{
		UpSignal = TriggOsc >= 0 AND KPTriggerLine > KPStopLine AND KPScoreCard > parmSCThreshold AND KPSTTB >= 0 AND (KPMediumUp > KPMediumMa OR KPMediumDn > KPMediumMa) AND C > UpperBand ;
		DnSignal = TriggOsc < 0 AND KPTriggerLine < KPStopLine AND KPScoreCard < parmSCThreshold AND KPSTTB < 0 AND (KPMediumUp < KPMediumMA OR KPMediumDn < KPMediumMA) AND C < LowerBand;
	}
else	//assume Middle band
	{
		UpSignal = TriggOsc >= 0 AND KPTriggerLine > KPStopLine AND KPScoreCard > parmSCThreshold AND KPSTTB >= 0 AND (KPMediumUp > KPMediumMa OR KPMediumDn > KPMediumMa) AND C > MALRCurve ;
		DnSignal = TriggOsc < 0 AND KPTriggerLine < KPStopLine AND KPScoreCard < parmSCThreshold AND KPSTTB < 0 AND (KPMediumUp < KPMediumMA OR KPMediumDn < KPMediumMA) AND C < MALRCurve;
	}
UpSignal = ExRem(UpSignal, DnSignal);	//remove duplicate signals
DnSignal = ExRem(DnSignal, UpSignal);

if(parmDebug == 1)
	{
		printf("Detrend: %g%\UpperBand: %g%\nLowerBand: %g%\n", Detrend, UpperBand, LowerBand);
		printf(WriteIf(UpSignal, "UpSignal: True", "UpSignal: False") + WriteIf(DnSignal, " DnSignal: True\n", " DnSignal: False\n") );

	}
//plots
if(parmPlotRibbon == 0)
	{
		PlotShapes(IIf(UpSignal, shapeCircle, shapeNone), parmPPUpColor, 0, L, -10);
		PlotShapes(IIf(DnSignal, shapeCircle, shapeNone), parmPPDnColor, 0, H, 10);
	}
else
	{
		Plot(parmRibbonSize, "", IIf(UpSignal, parmPPUpColor, IIf(DnSignal, parmPPDnColor, Null )), styleArea |  styleNoLabel | styleOwnScale , 0, 10);

	}
if(parmPlotEBand == 1)
	{
		Plot( MALRCurve , "MidBand", parmMBColor , parmMBStyle);
		Plot( UpperBand , "UpperBand",parmUBColor ,parmUBStyle );
		Plot( LowerBand , "LowerBand", parmLBColor , parmLBStyle);
	}
if(parmVoice == 1)
	{
		if(NewBarSignal)
			{
				BarUpSince = BarsSince(UpSignal);
				BarDnSince = BarsSince(DnSignal);
				Stop = IIf( BarUpSince <= BarDnSince, Ref(L, - BarUpSince) - ticker.TickSize, Ref(H, - BarDnSince) + ticker.TickSize);
				if(LastValue(Ref(UpSignal, -1)) ) Say(Interval(2) + " Power pop: up.  Stop at " + NumToStr(Ref(L, -1) - ticker.TickSize, 1.2) + ".");
				if(LastValue(Ref(DnSignal, -1)) ) Say(Interval(2) + " Power pop: down.  Stop at " + NumToStr(Ref(H, -1) + ticker.TickSize, 1.2) + ".");
			}

	}
if(parmPlotTargets == 1)
	{
		//RangeAvg = MRoundB(Ref(MA(H-L, 5), -1) , ticker.ticksize ) ;
		BarUpSince = BarsSince(UpSignal);
		BarDnSince = BarsSince(DnSignal);
		//PT = IIf( BBarUpSince <= BBarDnSince, Ref(O, - BBarUpSince + 1 ) + Ref(RangeAvg, -BBarUpSince -1), Ref(O, - BBarDnSince + 1) - Ref(RangeAvg, -BBarDnSince -1) );
		Stop = IIf( BarUpSince <= BarDnSince, Ref(L, - BarUpSince) - ticker.TickSize, Ref(H, - BarDnSince) + ticker.TickSize);
		Plot(Stop, "Stop", parmTargetColor, parmTargetStyle);
		//Plot(PT, "Target", colorGreen, styleLine | styleStaircase);
	}

_SECTION_BEGIN("Price");
SetChartOptions(0,chartShowArrows|chartShowDates);
_N(Title = StrFormat("{{NAME}} - {{INTERVAL}} {{DATE}} Open %g, Hi %g, Lo %g, Close %g (%.1f%%) Vol " +WriteVal( V, 1.0 ) +" {{VALUES}}", O, H, L, C, SelectedValue( ROC( C, 1 )) ));
Plot( C, "Close", ParamColor("Color", colorBlack ), styleNoTitle | ParamStyle("Style") | GetPriceStyle() );
if( ParamToggle("Tooltip shows", "All Values|Only Prices" ) )
{
 ToolTip=StrFormat("Open: %g\nHigh:  %g\nLow:   %g\nClose:  %g (%.1f%%)\nVolume: "+NumToStr( V, 1 ), O, H, L, C, SelectedValue( ROC( C, 1 )));
}
_SECTION_END();
4 comments
Leave Comment
Please login here to leave a comment.
How does one install the foundation plug in which is available as rar extension file – can someone elaborate the steps after downloading?
here shown synatax error. plz give with full details, other wise not useful.
To Install this indicator
1)Extract the Foundation-Int.rar and save it in your local hard drive
2)Copy JurikLib.dll and kpami.dll and paste it in your Amibroker Plugin folder which is by default C:\Program Files\AmiBroker\Plugins
3)Copy this formula and paste it in AFL formula-custom folder C:\Program Files\AmiBroker\Formulas\Custom
4)Now to view the charts Open Amibroker and goto File→New→New Chart
5)then goto View→Charts and select the afl from the left plane under the Custom folder
Thanks to arm for the guide.
Hi,
i am getting following error while using the afl.
“Error 29.
Variable ‘kpstopline’ used without having been initialized.”
can anyone help me?
Thanks,
…SS