Ichimoku for Amibroker (AFL)
prashantrdx about 12 years ago Amibroker (AFL)
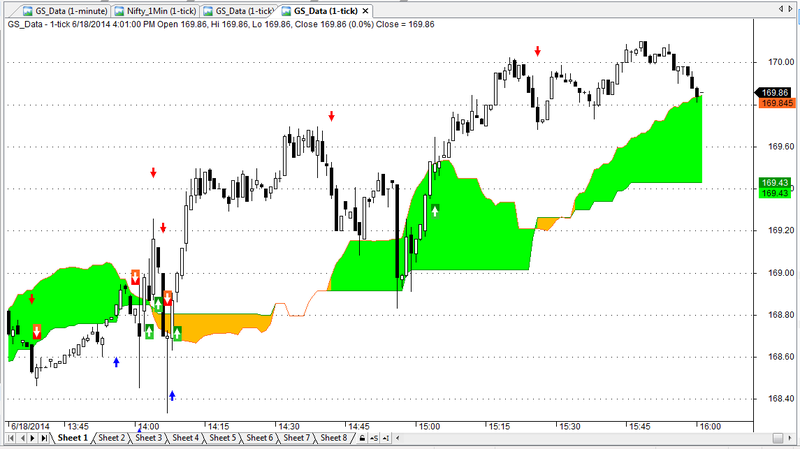
Ichimoku Cloud Breakout for Intraday Trading.
Screenshots
Indicator / Formula
Copy & Paste Friendly
SetChartOptions(0,chartShowArrows|chartShowDates);
Plot( C, "Close", colorBlack, styleCandle );
_N(Title = StrFormat("{{NAME}} - {{INTERVAL}} {{DATE}} Open %g, Hi %g, Lo %g, Close %g (%.1f%%) {{VALUES}}", O, H, L, C, SelectedValue( ROC( C, 1 ) ) ));


per1= Param("Standard/Base Line Period", 26, 1, 100, 1);
per2= Param("Turning/Conversion Line Period", 9, 1, 100, 1);
per3= Param("Span2 Period", 52, 1, 200, 1);
per4= Param("Trailing SL %", 0.2, 0, 100, 0.01);
per10= Param("Trade Entry From(HHMM)", 0900, 900, 2325, 1);
per11= Param("Trade Entry Upto(HHMM)", 2325, 900, 2325, 1);
per12= Param("Trade Exit(HHMM)", 2328, 900, 2328, 1);

intra_ex= TimeNum()>per12*100;
intra_en= TimeNum()<per11*100 AND TimeNum()>per10*100;

SL = ( HHV( H, per1 ) + LLV( L, per1) )/2;
TL = ( HHV( H, per2 ) + LLV( L, per2 ) )/2;
DL = Ref( C, 26 );
Span1 = Ref((( SL + TL )/2),-per1);
Span2 = Ref((HHV( H, per3) + LLV(L, per3))/2,-per1);

//Plot(SL,"SL",colorRed,styleThick); // standard, base, or kijun-sen line
//Plot(TL,"TL",colorBlue,styleThick); // turning, conversion, or tenkan-sen line

Plot(span1,"",colorOrange); // standard, base, or kijun-sen line
Plot(span2,"",colorGreen);
printf("span1 " + span1+ " span2 "+ span2+ " C " + C);
PlotOHLC(Span1,Span2,Span1,Span2,"",IIf(Span1>Span2,8,9),styleCloud);

Buy1 = Ref(C,-1)> Ref(Max(span1,span2),-1) AND  Ref(C,-2)<= Ref(Max(span1,span2),-2);
Sell1 = Ref(C,-1)< Min(Ref(span1,-1),Ref(span2,-1)) AND  Ref(C,-2)>= Min(Ref(span1,-2),Ref(span2,-2));

Buy= Buy1 AND intra_en;
BuyPrice= ValueWhen(Buy,O);
tgt= L<(HHV(H,BarsSince(Buy)+1)*(1-per4/100));
Sell= (Ref(L,-1)> Min(Ref(span1,-1),Ref(span2,-1)) AND  L<=Min(span1,span2)) OR intra_ex OR tgt ;
SellPrice= IIf(tgt, (HHV(H,BarsSince(Buy)+1)*(1-per4/100)), Min(span1,span2));
Buy = ExRem( Buy, Sell);
Sell= ExRem(Sell,Buy);

Short= Sell1 AND intra_en;
ShortPrice= ValueWhen(Short,O);
tgts= H>(LLV(L,BarsSince(Short)+1)*(1+per4/100));
Cover= (H>=Max(span1,span2) AND Ref(H,-1)<Ref(Max(span1,span2),-1))  OR intra_ex OR tgts;
CoverPrice= IIf(tgts, (LLV(L,BarsSince(Short)+1)*(1+per4/100)), Max(span1,span2));
Short = ExRem( Short, Cover );
Cover = ExRem( Cover, Short );

printf("\nshort: "+ BarsSince(Buy));
PlotShapes( IIf( Buy, shapeSquare, shapeNone ), colorGreen, 0, L, Offset = -40 );
PlotShapes( IIf( Buy, shapeSquare, shapeNone ), colorLime, 0, L, Offset = -50 );
PlotShapes( IIf( Buy, shapeUpArrow, shapeNone ), colorWhite, 0, L, Offset = -45 );
PlotShapes( IIf( Sell, shapeDownArrow, shapeNone ), colorRed, 0, H, Offset = -65 );
PlotShapes( IIf( Short, shapeSquare, shapeNone ), colorRed, 0, H, Offset = 40 );
PlotShapes( IIf( Short, shapeSquare, shapeNone ), colorOrange, 0, H, Offset = 50 );
PlotShapes( IIf( Short, shapeDownArrow, shapeNone ), colorWhite, 0, H, Offset = -45 );
PlotShapes( IIf( Cover, shapeUpArrow, shapeNone ), colorBlue, 0, L, Offset = -65 );
0 comments
Leave Comment
Please login here to leave a comment.