Pride System Modified for Amibroker (AFL)
niladri over 14 years ago Amibroker (AFL)
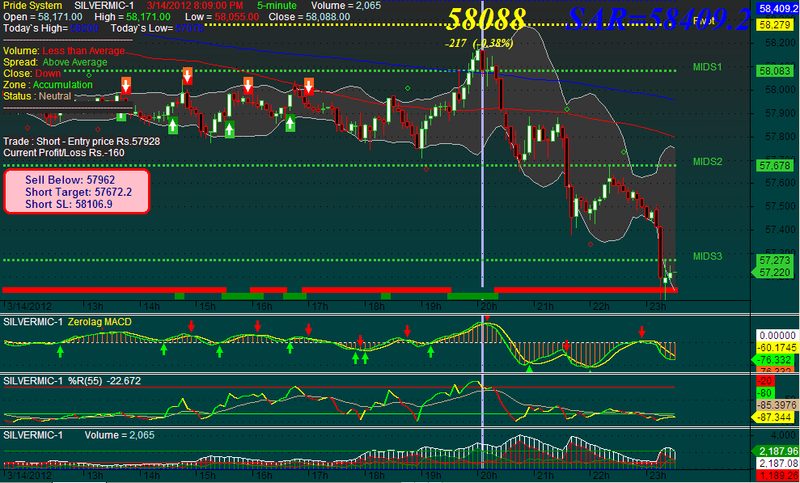
The Pride System
++++++++++++++++
Discussion: http://www.traderji.com/day-trading/29798-prides-intra-day-strategy-profit-everyday.html
This system utilizes Dual time-frame Momentum and EMA Crossovers ( 5/13 ) on a 5 Minute Chart and is best suited to trade Nifty Futures, though any stock can be traded with this system over any time frame.
I added some signal filter & included Market Profile, Essential Trader Tool, VSA Analysis on the AFL.
Bollinger Band is provided as a guide to get overview of Volatility & 100/200 DMA lines provided as an additional guide to your trading.
Entry Strategy
======
1. In the 30 Minute Chart, the Stochastic should be bullish.
(That is, the fast stochastic line should have crossed over the slow line. It does not matter how long ago the crossover took place, it should just be above the slow line and should be going upwards).
2. In the 5 Minute Chart, the Stochastic should be bullish as well.
(Fast stochastic line should have crossed over the slow line and should be moving upwards. It should not be in overbought condition yet, that is, it should not have crossed 80 yet).
3. The 5 Period EMA crossed over the 13 Period EMA from below and moves upwards.
When all three conditions are met, we buy, placing stop loss at the low of the last bar or the bar to the left of the last bar, whichever is lower.
Stochastic Setting is 8,3,4 for this system.
Exit Strategy
=====
1. When fast Stochastic reverses from it’s upward move, curves downwards and crosses the slow line from above, sell half of the units.
2. If the next bar goes below the low of the previous bar, exit completely, otherwise keep a tight trailing stop loss and enjoy the continuing bull market.
Screenshots
Indicator / Formula
SetChartOptions(0,chartShowArrows|chartShowDates);
SetChartBkColor(ParamColor("Outer panel",colorDarkOliveGreen)); // color of outer border
SetChartBkGradientFill( ParamColor("Inner panelupper",colorDarkGrey), ParamColor("Inner panel lower",colorDarkOliveGreen));
Plot(C,"Price",IIf(O>C,32,34),64);// bary - swiece
SetBarFillColor(IIf(O>C,24,19));

_SECTION_BEGIN("MID MA");
P = ParamField("Price field",-1);
Periods = Param("Periods", 100, 2, 400, 1 );
Plot( MA( P, Periods ), _DEFAULT_NAME(), ParamColor( "Color", colorCycle ), ParamStyle("Style", styleLine | styleNoLabel ) | styleNoRescale );
_SECTION_END();

_SECTION_BEGIN("Long MA");
P = ParamField("Price field",-1);
Periods = Param("Periods", 200, 2, 400, 1 );
Plot( MA( P, Periods ), _DEFAULT_NAME(), ParamColor( "Color", colorCycle ), ParamStyle("Style", styleLine | styleNoLabel ) | styleNoRescale );
_SECTION_END();

_SECTION_BEGIN("BBands");
P = ParamField("Price field",-1);
Periods = Param("Periods", 15, 2, 100, 1 );
Width = Param("Width", 2, 0, 10, 0.05 );
Color = ParamColor("Color", colorLightGrey );
Style = ParamStyle("Style", styleLine | styleNoLabel ) | styleNoRescale;;
Plot( bbt = BBandTop( P, Periods, Width ), "BBTop" + _PARAM_VALUES(), Color, Style );
Plot( bbb = BBandBot( P, Periods, Width ), "BBBot" + _PARAM_VALUES(), Color, Style );
PlotOHLC( bbt, bbt, bbb, bbb, "", ColorBlend( Color, colorDarkGrey, 0.9 ), styleNoLabel | styleCloud | styleNoRescale, Null, Null, Null, -1 );
_SECTION_END();

_SECTION_BEGIN("Magnified Price");
FS=Param("Font Size",30,11,100,1);
GfxSelectFont("Times New Roman", FS, 700, True );
GfxSetBkMode( colorWhite );
GfxSetTextColor( ParamColor("Color",colorYellow) );
Hor=Param("Horizontal Position",550,1,1200,1);
Ver=Param("Vertical Position",1,1,830,1);
GfxTextOut(""+C, Hor , Ver );
YC=TimeFrameGetPrice("C",inDaily,-1);
DD=Prec(C-YC,2);
xx=Prec((DD/YC)*100,2);
GfxSelectFont("Times New Roman", 11, 700, True );
GfxSetBkMode( colorWhite );
GfxSetTextColor(ParamColor("Color",colorYellow) );
GfxTextOut(""+DD+"  ("+xx+"%)", Hor , Ver+45 );
_SECTION_END();

_SECTION_BEGIN("5DMA - Stop & Reverse");
FS=Param("Font Size",30,11,100,1);
GfxSelectFont("Times New Roman", FS, 700, True );
GfxSetBkMode( colorWhite );
GfxSetTextColor( ParamColor("Color",colorBlue) );

Hor=Param("Horizontal Position",700,1,1200,1);
Ver=Param("Vertical Position",1,1,830,1);

TC=TimeFrameGetPrice("C",inDaily,0);
YYC=TimeFrameGetPrice("C",inDaily,-1);
DFYC=TimeFrameGetPrice("C",inDaily,-2);
DFYC1=TimeFrameGetPrice("C",inDaily,-3);
DFYC2=TimeFrameGetPrice("C",inDaily,-4);
SAR1=Prec((TC+YYC+DFYC+DFYC1+DFYC2)/5,5);
GfxTextOut("SAR="+SAR1, Hor , Ver );

SaaR = ParamToggle("SAR","Show|Hide",1);
if(SaaR==1)
{
	Plot (SAR1,"",colorBlue,styleDots|styleNoLine|styleNoRescale|styleNoTitle);
}
_SECTION_END();

_SECTION_BEGIN("Pride System");

periods = Param( "Periods", 8, 1, 200, 1 );
Ksmooth = Param( "%K avg", 4, 1, 200, 1 );
Dsmooth = Param( "%D avg", 3, 1, 200, 1 );

TimeFrameSet(in1Minute * 30);
k30 = StochK( periods , Ksmooth);
d30 = StochD( periods , Ksmooth, DSmooth );
TimeFrameRestore();

K = TimeFrameExpand(k30, in1Minute * 30);
D = TimeFrameExpand(d30, in1Minute * 30);

Hi = IIf(k > d, k, d);
Lo = IIf(k < d, k, d);

periods1 = Param( "Periods1", 8, 1, 200, 1 );
Ksmooth1 = Param( "%K avg", 4, 1, 200, 1 );
Dsmooth1 = Param( "%D avg", 3, 1, 200, 1 );

U = StochK( periods1 , Ksmooth1);
T = StochD( periods1 , Ksmooth1, DSmooth1 );

x = EMA(Close,5);
y = EMA(Close,13);

Buy=((K > D) AND (U > T) AND (U < 75 AND T < 75) AND (x>=y));
Sell=Cross(T,U) OR (T>=U);

Longa = Flip(Buy,Sell);
shrta = Flip(Sell,Buy);

Buy = ExRem(Buy,Sell);
Sell = ExRem(Sell,Buy);

Filter = Buy OR Sell;

AddTextColumn(FullName(),"Name");
AddColumn( Buy, "BUY" );
AddColumn( Sell, "SELL" );

t1= Flip(Buy,Sell);
t2= Flip(Sell,Buy);

BPrice=ValueWhen(t1 AND Ref(t1,-1)==0,C,1);
SPrice=ValueWhen(t2 AND Ref(t2,-1)==0,C,1);

Short=((D > K) AND (T > U) AND (U > 25 AND T > 25) AND (y>=x));
Cover=Cross(U,T) OR (T<=U);

Short = ExRem(Short,Cover);
Cover = ExRem(Cover,Short);

PlotShapes(IIf(Short, shapeHollowSmallCircle, shapeNone),colorBrightGreen, 0,H, Offset=30);
PlotShapes(IIf(Cover, shapeHollowSmallCircle, shapeNone),colorRed, 0,L, Offset=-30);

GraphXSpace = 5;

dist = 2*ATR(10);
dist1 = 3*ATR(10);

for( i = 0; i < BarCount; i++ )
{
    if( Buy[i] )
    {
        // PlotText( "\nBuy:" + L[ i ] + "\nT= " + (L[i]*1.005) + "\nSL= " + (L[i]*0.9975), i, L[ i ]-dist[i], colorGreen, colorWhite );

        // Signal Display Panel //

        BuyStop2 = L[i]*0.9975;
        BuyTP1 = L[i]*1.005;

        GfxSetOverlayMode( mode = 0 );
        GfxSelectPen( colorBlue, 3 );
        GfxSelectSolidBrush( colorWhite );
        GfxRoundRect( 05, 210, 185, 265, 15, 15 );
        GfxSetBkMode(1);
        GfxSelectFont( "Arial", 10, 700, False );
        GfxSetTextColor( colorDarkBlue );
        GfxSetTextAlign(0);

        GfxTextOut( WriteIf(L[ i ], "Buy Above: "+L[ i ],""), 30, 215);
        GfxTextOut( WriteIf(BuyTP1, "Buy Target: "+(BuyTP1),""), 30, 230);
        GfxTextOut( WriteIf(BuyStop2, "Long SL: "+(BuyStop2),""), 30, 245);
        // END of Signal Display Panel //
    }
    if( Sell[i] )
    {
        // PlotText( "Sell:" + H[ i ] + "\nT= " + (H[i]*0.995) + "\nSL= " + (H[i]*1.0025), i, H[ i ]+dist1[i], colorRed, colorWhite );

        // Signal Display Panel //
        SellStop2 = H[i]*1.0025;
        SellTP1 = H[i]*0.995;

        GfxSetOverlayMode( mode = 0 );
        GfxSelectPen( colorRed, 3 );
        GfxSelectSolidBrush( colorPink );
        GfxRoundRect( 05, 210, 185, 265, 15, 15 );
        GfxSetBkMode(1);
        GfxSelectFont( "Arial", 10, 700, False );
        GfxSetTextColor( colorDarkBlue );
        GfxSetTextAlign(0);
        GfxTextOut( WriteIf(H[ i ], "Sell Below: "+H[ i ],""), 30, 215);
        GfxTextOut( WriteIf(SellTP1, "Short Target: "+(SellTP1),""), 30, 230);
        GfxTextOut( WriteIf(SellStop2, "Short SL: "+(SellStop2),""), 30, 245);
        // END of Signal Display Panel //
    }

}


PlotShapes(IIf(Buy, shapeSquare, shapeNone),colorGreen, 0, L, Offset=-10);
PlotShapes(IIf(Buy, shapeSquare, shapeNone),colorLime, 0,L, Offset=-20);
PlotShapes(IIf(Buy, shapeUpArrow, shapeNone),colorWhite, 0,L, Offset=-15);
PlotShapes(IIf(Sell, shapeSquare, shapeNone),colorRed, 0, H, Offset=10);
PlotShapes(IIf(Sell, shapeSquare, shapeNone),colorOrange, 0,H, Offset=20);
PlotShapes(IIf(Sell, shapeDownArrow, shapeNone),colorWhite, 0,H, Offset=-15);
AlertIf( Buy, "SOUND C:\\Windows\\Media\\Ringin.wav", "Audio alert", 2 );
AlertIf( Sell, "SOUND C:\\Windows\\Media\\Ringin.wav", "Audio alert", 2 );
_SECTION_END();

_SECTION_BEGIN("VSA by Mr.Karthik");
DTL=Param("Linear regression period",60,10,100,10);
wbf=Param("WRB factor",1.5,1.3,2.5,.1);
nbf=Param("NRB factor",0.7,0.3,0.9,0.1);
TL=LinRegSlope(MA(C, DTL),2);
 Vlp=Param("Volume lookback period",30,20,300,10);
Vrg=MA(V,Vlp);
St = StDev(Vrg,Vlp);
Vp3 = Vrg + 3*st;
Vp2 = Vrg + 2*st;;
Vp1 = Vrg + 1*st;;
Vn1 = Vrg -1*st;
Vn2 = Vrg -2*st;
rg=(H-L);
arg=Wilders(rg,30);
wrb=rg>(wbf*arg);
nrb=rg<(nbf*arg);
Vl=V<Ref(V,-1) AND V<Ref(V,-2);
upbar=C>Ref(C,-1);
dnbar=C<Ref(C,-1);
Vh=V>Ref(V,-1) AND Ref(V,-1)>Ref(V,-2);
Cloc=C-L;
x=rg/Cloc;
x1=IIf(Cloc=0,arg,x);
Vb=V>Vrg OR V>Ref(V,-1);
ucls=x1<2;
dcls=x1>2;
mcls=x1<2.2 AND x1>1.8 ;
Vlcls=x1>4;
Vhcls=x1<1.35;
j=MA(C,5);
TLL=LinRegSlope(j,40) ;
Tlm=LinRegSlope(j,15) ;
tls=LinRegSlope(j,5);
mp=(H+L)/2;

Pp1=Param("NumberOfDays",30,1,200,1);
Pp2=Param("VolOfDays",15,1,200,1);

numDays = Pp1;
dwWideSpread = 1.8;
dwNarrowSpread = 0.8;
dwSpreadMiddle = 0.5;
dwHighClose = 0.7;
dwLowClose = 0.3;

volNumDays = Pp2;
dwUltraHighVol = 2;
dwVeryHighVol = 1.75; // was 1.8
dwHighVol = 1.75; // was 1.8
dwmoderateVol = 1.10; // was 1.8
dwLowVol = 0.75; // was 0.8

////////////////////////////////////////////////////////////////////////////////////
// Classify each bar...
///////////////////////////////////////////////////////////////////////////////////

upBar = C > Ref(C,-1);
downBar = C < Ref(C,-1);
spread = H-L;
avgRange = Sum(spread, numDays) / numDays;
wideRange = spread >= (dwWideSpread * avgRange);
narrowRange = spread <= (dwNarrowSpread * avgRange);
testHighClose = L + (spread * dwHighClose);
testLowClose = L + (spread * dwLowClose);
testCloseMiddle = L + (spread * dwSpreadMiddle);

upClose = C > testHighClose;
downClose = C < testLowClose;
middleClose = C >= testLowClose AND C <= testHighClose;

avgVolume = EMA(V, volNumDays);

highVolume = V > (avgVolume * dwHighVol);
moderateVol= V > (avgVolume * dwmoderateVol);
veryHighVolume = V > (avgVolume * dwVeryHighVol);
ultraHighVolume = V > (avgVolume * dwUltraHighVol);
LowVolume = V < (avgVolume * dwLowVol);

////////////////////////////////////////////////////////////////////////////////////
// direction and title
////////////////////////////////////////////////////////////////////////////////////
////////////////////////////////////////////////////////////////////////////////////
//
// Basic patterns...
//
////////////////////////////////////////////////////////////////////////////////////

upThrustBar = downClose AND H > Ref(H,-1) AND (C == L) AND downClose AND (NOT narrowRange);
noDemandBar = narrowRange AND LowVolume AND upBar AND (NOT upClose);
//noDemandBar = narrowRange AND LowVolume AND upBar AND (V < Ref(V,-1)) AND (V < Ref(V,-2));
noSupplyBar = narrowRange AND LowVolume AND downBar AND (V < Ref(V,-1)) AND (V < Ref(V,-2));
absorption = Ref(downbar, -1) AND Ref(highVolume, -1) AND upBar;
support = Ref(downBar,-1) AND (NOT Ref(downClose,-1)) AND Ref(highVolume,-1) AND upBar;
stoppingVolume = Ref(downBar,-1) AND Ref(highVolume,-1) AND C > testCloseMiddle AND (NOT downBar);
bullishsign=moderateVol+UpThrustBar;//OR moderateVol+upBar;
//rallyEnd = (Ref(highVolume,-1) AND Ref(upBar,-1) AND wideRange AND downBar) OR
// (narrowRange AND highVolume AND H > Ref(HHV(H, 250), -1));


////////////////////////////////////////////////////////////////////////////////////
//
// Strength and Weakness
//
////////////////////////////////////////////////////////////////////////////////////

weakness = upThrustBar OR noDemandBar OR (narrowRange AND (H > Ref(H,-1)) AND highVolume) OR (Ref(highVolume,-1) AND Ref(upBar,-1) AND downBar AND (H < Ref(H,-1)));

/////////////////////////////////////////////////////////////////////////////////////////////

C1 = Ref(C, -1);
uc = C > C1; dc = C <= C1;
ud = C > O; dd = C <= O;

green = 1; blue = 2; yellow = 3; red = 4; white = 5;
VType = IIf(ud, IIf(uc, green, yellow), IIf(dd,IIf(dc, red, blue), white));

/* green volume: up-day and up-close*/
gv = IIf(VType == green, V, 0);
/* yellow volume: up-day but down-close */
yv = IIf(VType == yellow, V, 0);
/* red volume: down-day and down-close */
rv = IIf(VType == red, V, 0);
/* blue volume: down-day but up-close */
bv = IIf(VType == blue, V, 0);

uv = gv + bv; uv1 = Ref(uv, -1); /* up volume */
dv = rv + yv; dv1 = Ref(dv, -1); /* down volume */

/* create moving average period parameters */
VolPer = Param("Adjust Vol. MA per.", 34, 1, 255, 1);
ConvPer = Param("Adjust Conv. MA per.", 9, 1, 255, 1);

/* create triple exponential moving avearges of separate up and down volume
moving averages */
MAuv = TEMA(uv, VolPer ); mauv1 = Ref(mauv, -1);
MAdv = TEMA(dv, VolPer ); madv1 = Ref(madv, -1);
MAtv = TEMA(V, VolPer );//total volume

/* Switch for Horizontal lines indicating current level of positive and
negative volume for ease in comparing to past highs/lows - toggle via
parmameter window */
OscillatorOnly = Param("Show Oscillator Only", 0, 0, 1, 1);
CompareBullVolume = Param("Show Bull Level", 1, 0, 1, 1);
if(CompareBullvolume AND !OscillatorOnly){
//Plot(SelectedValue(MAuv), "", colorGreen, styleLine);
}

CompareBearVolume = Param("Show Bear Level", 1, 0, 1, 1);
if(CompareBearVolume AND !OscillatorOnly){
//Plot(SelectedValue(MAdv), "", colorRed, styleLine);
}

/* Volume Segment Switches - toggle via parameter window */
bullvolume = Param("Show Bull Volume", 1, 0, 1, 1);
bearvolume = Param("Show Bear Volume", 1, 0, 1, 1);
totalvolume = Param("Show Total Volume", 1, 0, 1, 1);

/* plot volume lines and histograms if toggled on: */
bearToFront = Param("Show Bear Vol in Front", 0, 0, 1, 1);
if(bearToFront AND !OscillatorOnly){
//Plot(MAdv, "", colorRed, styleHistogram|styleNoLabel);
}
if(bullvolume AND !OscillatorOnly){
//Plot(MAuv, "Average Bull Volume", colorGreen, styleHistogram|styleNoLabel);
}
if(bearvolume AND !OscillatorOnly){
//Plot(MAdv, "Average Bear Volume", colorRed, styleHistogram|styleNoLabel);
}
if(totalVolume AND !OscillatorOnly){
//Plot(MAtv, "Total Volume", colorWhite, styleHistogram|styleNoLabel);
//Plot(MAtv, "", colorWhite, styleLine);
}
if(bullvolume AND !OscillatorOnly){
//Plot(MAuv, "", colorGreen, styleLine);
}
if(bearvolume AND !OscillatorOnly){
//Plot(MAdv, "", colorRed, styleLine);
}

/* better visibility of zero line: */
//Plot(0, "", colorBlue, 1);

/* Rise/Fall Convergence variables:  */
Converge = (TEMA(MAuv - MAdv, ConvPer));
Converge1 = Ref(Converge, -1);
ConvergeUp = Converge > Converge1;
ConvergeOver = Converge > 0;
rising = ConvergeUp AND ConvergeOver;
falling = !ConvergeUp AND ConvergeOver;

/* Rise/Fall Convergence Oscillator Switch  - toggle via parameter window - (provides a better view of resulting combination of battling bull/bear volume forces) */
convergenceOscillator = Param("Show Oscillator", 0, 0, 1, 1);
if(convergenceOscillator OR OscillatorOnly){
//Plot(Converge, "Bull/Bear Volume Convergence/Divergence", colorViolet,1|styleLeftAxisScale|styleNoLabel|styleThick);
//Plot(0,"", colorYellow, 1|styleLeftAxisScale|styleNoLabel);
}

/********************************************************
 Convergence Rise/Fall Shadows:

 (provides a more easily visible display of rising and falling  bull/bear
volume convergence) - toggle via parameter window

-posiitive Volume exceeding negative Volume: Light shadow
-negative volume exceeding positive volume: dark shadow
-if you use standard gray background - best shadows are:
-my greys: 14 = (216, 216, 216); 15 = (168, 168, 168));
-best substitute? using AB color constants?
-light: colorpalegreen; dark: colorRose;?
-(depends on your color scheme - customize to your tastes)
**********************************************************/

/* uncomment if you use my custom color greys: */
riseFallColor = IIf(rising, 14,15); //my custom shadow greys

/* comment out if you use my custom color gray shadows: */
/* riseFallColor = IIf(rising, colorPaleGreen,colorRose); */

/* Rise/Fall Convergence Plot Switch - toggle via parameter window */
riseFallShadows = Param("Show RiseFallShadows", 0, 0, 1, 1);
if(riseFallShadows){
//Plot(IIf(rising OR falling, 1, 0), "", riseFallColor,styleHistogram|styleArea|styleOwnScale|styleNoLabel);
}
_SECTION_END();

_SECTION_BEGIN("Title");

dec = (Param("Decimals",2,0,7,1)/10)+1;

TimeFrameSet(inDaily);
DayH = LastValue(H);
DayL = LastValue(L);
TimeFrameRestore();

if( Status("action") == actionIndicator )
(Title = EncodeColor(colorYellow)+ "Pride System" + "     " + EncodeColor(55)+  Name() + "     " + EncodeColor(32) + Date() + "      " + EncodeColor(5) + "{{INTERVAL}}  " + EncodeColor(55)+ "    Volume = "+ EncodeColor(52)+ WriteVal(V,1) + "\n" +
   EncodeColor(55)+ "Open = "+ EncodeColor(52)+ WriteVal(O,dec) +
   EncodeColor(55)+ "     High = "+ EncodeColor(5) + WriteVal(H,dec) +
   EncodeColor(55)+ "      Low = "+ EncodeColor(32)+ WriteVal(L,dec) +
   EncodeColor(55)+ "    Close = "+ EncodeColor(52)+ WriteVal(C,dec) + "\n" +
   EncodeColor(55)+ "Today`s High= " + EncodeColor(colorBlue) + DayH + EncodeColor(55)+ "     Today`s Low= " + EncodeColor(colorBlue) + DayL +"\n"+

EncodeColor(colorPink)+"----------------------------------------"
+"\n"+EncodeColor(07)+"Volume: "+WriteIf(V>Vp2,EncodeColor(colorLime)+"Very High",WriteIf(V>Vp1,EncodeColor(colorLime)+" High",WriteIf(V>Vrg,EncodeColor(colorLime)+"Above Average",
WriteIf(V<Vrg AND V>Vn1,EncodeColor(colorRed)+"Less than Average",WriteIf(V<Vn1,EncodeColor(colorRed)+"Low","")))))

+"\n"+EncodeColor(colorYellow)+"Spread: "+WriteIf(rg >(arg*2),EncodeColor(colorLime)+" Wide",WriteIf(rg>arg,EncodeColor(colorLime)+" Above Average",EncodeColor(colorRed)+" Narrow"))

+"\n"+(EncodeColor(colorYellow)+"Close: ")+WriteIf(Vhcls,EncodeColor(colorLime)+"Very High",WriteIf(ucls,EncodeColor(colorLime)+"High",WriteIf(mcls,EncodeColor(colorYellow)+"Mid",
WriteIf(dcls,EncodeColor(colorRed)+"Down","Very Low"))))

+"\n"+EncodeColor(colorYellow) + "Zone : " +WriteIf(rising , EncodeColor(colorBrightGreen) + "Accumulation",WriteIf(falling , EncodeColor(colorCustom12) + "Distirbution",EncodeColor(colorAqua) + "Flat")) + " "
+"\n"+
EncodeColor(colorYellow) + "Status : " +
WriteIf(Weakness , EncodeColor(colorRed) + "Weak",
WriteIf(stoppingVolume , EncodeColor(colorCustom12) + "StoppingVol",
WriteIf(noSupplyBar , EncodeColor(colorLightOrange) + "NoSupply",
WriteIf(support , EncodeColor(colorLightBlue) + "SupportVol",
WriteIf(noDemandBar , EncodeColor(colorPink) + "NoDemand",
WriteIf(absorption, EncodeColor(colorSkyblue) + "Absorption",
WriteIf(upThrustBar, EncodeColor(colorBlue) + "Upthrust",
WriteIf(bullishsign, EncodeColor(colorPaleGreen) + "STRONG",
EncodeColor(colorTan) + "Neutral")))))))) + " "
+"\n"+EncodeColor(colorPink)+"----------------------------------------"+"\n"+

   EncodeColor(colorLime)+WriteIf (Buy , "GO LONG / Reverse Signal at "+C+"  ","")+
   EncodeColor(colorRed)+WriteIf (Sell , "EXIT LONG / Reverse Signal at "+C+"  ","")+"\n"+
   EncodeColor(colorWhite)+WriteIf(Sell , "Total Profit/Loss for the Last Trade Rs."+(C-BPrice)+"","")+
   WriteIf(Buy  , "Total Profit/Loss for the Last trade Rs."+(SPrice-C)+"","")+"\n"+
   WriteIf(Longa AND NOT Buy, "Trade : Long - Entry price Rs."+(BPrice),"")+
   WriteIf(shrta AND NOT Sell, "Trade : Short - Entry price Rs."+(SPrice),"")+"\n"+
   WriteIf(Longa AND NOT Buy, "Current Profit/Loss Rs."+(C-BPrice)+"","")+
   WriteIf(shrta AND NOT Sell, "Current Profit/Loss Rs."+(SPrice-C)+"",""));

_SECTION_END();

_SECTION_BEGIN("Linear Regression");
Lrc = ParamToggle("Linear Regression Channel","Show|Hide",0);
if(Lrc==1) {
//====================================Start of Linear Regression Code==================================================================================

P = ParamField("Price field",-1);

Length = 150;

Daysback = Param("Period for Liner Regression Line",Length,1,240,1);
shift = Param("Look back period",0,0,240,1);

//=============================== Math Formula ========================================================================================================

x = Cum(1);
lastx = LastValue( x ) - shift;
aa = LastValue( Ref(LinRegIntercept( p, Daysback), -shift) );
bb = LastValue( Ref(LinRegSlope( p, Daysback ), -shift) );
y = Aa + bb * ( x - (Lastx - DaysBack +1 ) );

//==================Plot the Linear Regression Line ====================================================================================================

LRColor = ParamColor("LR Color", colorCycle );
LRStyle = ParamStyle("LR Style");

LRLine =  IIf( x > (lastx - Daysback) AND BarIndex() < Lastx, y, Null );

LRStyle = ParamStyle("LR Style");
Angle = Param("Angle", 0.05, 0, 1.5, 0.01);// A slope higher than 0.05 radians will turn green, less than -0.05 will turn red and anything in between will be white.

LRLine = IIf( x > (lastx - Daysback) AND BarIndex() < Lastx, y, Null );

Pi = 3.14159265 * atan(1); // Pi
SlopeAngle = atan(bb)*(180/Pi);

LineUp = SlopeAngle > Angle;
LineDn = SlopeAngle < - Angle;

if(LineUp)
{
Plot(LRLine, "Lin. Reg. Line Up", IIf(LineUp, colorBrightGreen, colorWhite), LRStyle);
}
else
{
Plot(LRLine, "Lin. Reg. Line Down", IIf(LineDn, colorDarkRed, colorWhite), LRStyle);
}

//==========================  Plot 1st SD Channel ======================================================================================================

SDP = Param("Standard Deviation", 1.5, 0, 6, 0.1);
SD = SDP/2;

width = LastValue( Ref(SD*StDev(p, Daysback),-shift) ); //Set width of inside chanels here.
SDU = IIf( x > (lastx - Daysback) AND BarIndex() < Lastx, y+width , Null ) ;
SDL = IIf( x > (lastx - Daysback) AND BarIndex() < Lastx, y-width , Null ) ;

SDColor = ParamColor("SD Color", colorCycle );
SDStyle = ParamStyle("SD Style");

Plot( SDU , "\nUpper Lin Reg", colorWhite,SDStyle ); //Inside Regression Lines
Plot( SDL , "Lower Lin Reg", colorWhite,SDStyle ); //Inside Regression Lines

//==========================  Plot 2d SD Channel ========================================================================================================

SDP2 = Param("2d Standard Deviation", 2.0, 0, 6, 0.1);
SD2 = SDP2/2;

width2 = LastValue( Ref(SD2*StDev(p, Daysback),-shift) ); //Set width of outside chanels here.
SDU2 = IIf( x > (lastx - Daysback) AND BarIndex() < Lastx, y+width2 , Null ) ;
SDL2 = IIf( x > (lastx - Daysback) AND BarIndex() < Lastx, y-width2 , Null ) ;

SDColor2 = ParamColor("2 SD Color", colorCycle );
SDStyle2 = ParamStyle("2 SD Style");

Plot( SDU2 , "Upper Lin Reg", colorWhite,SDStyle2 ); //OutSide Regression Lines
Plot( SDL2 , "Lower Lin Reg", colorWhite,SDStyle2 ); //OutSide Regression Lines

Trend = IIf(LRLine > Ref(LRLine,-1),colorGreen,colorRed);//Changes LR line to green if sloping up and red if sloping down.

Plot( LRLine , "LinReg", Trend, LRSTYLE );

//============================ End Indicator Code ========================================================================================================
}
_SECTION_END();

_SECTION_BEGIN("Supertrend");
procedure calcTrend_proc(ATR_Period,tr,ATR_Multiplier,TrendMode,CalcPrice)
{
	global buffer_line_down;
	global buffer_line_up;
	buffer_line_down = Null;
	buffer_line_up = Null;

	PHASE_NONE = 0;
	PHASE_BUY = 1;
	PHASE_SELL = -1;

	phase=PHASE_NONE;
	band_upper = 0;
	band_lower = 0;

	for(i = ATR_Period + 1; i < BarCount; i++)
	{
		band_upper = CalcPrice[i] + ATR_Multiplier * tr[i];
		band_lower = CalcPrice[i] - ATR_Multiplier * tr[i];

		if(phase==PHASE_NONE)
		{
			buffer_line_up[i] = CalcPrice[i];
			buffer_line_down[i] = CalcPrice[i];
		}
		if(phase!=PHASE_BUY && Close[i]>buffer_line_down[i-1] && !IsEmpty(buffer_line_down[i-1]))
		{
			phase = PHASE_BUY;
			buffer_line_up[i] = band_lower;
			buffer_line_up[i-1] = buffer_line_down[i-1];
		}
		if(phase!=PHASE_SELL && Close[i]<buffer_line_up[i-1] && !IsEmpty(buffer_line_up[i-1]))
		{
			phase = PHASE_SELL;
			buffer_line_down[i] = band_upper;
			buffer_line_down[i-1] = buffer_line_up[i-1];
		}
		if(phase==PHASE_BUY && ((TrendMode==0 && !IsEmpty(buffer_line_up[i-2])) || TrendMode==1) )
		{
			if(band_lower>buffer_line_up[i-1])
			{
				buffer_line_up[i] = band_lower;
			}
			else
			{
				buffer_line_up[i] = buffer_line_up[i-1];
			}
		}
		if(phase==PHASE_SELL && ((TrendMode==0 && !IsEmpty(buffer_line_down[i-2])) || TrendMode==1) )
		{
			if(band_upper<buffer_line_down[i-1])
			{
				buffer_line_down[i] = band_upper;
			}
			else
			{
				buffer_line_down[i] = buffer_line_down[i-1];
			}
		}
	}
}

TrendMode = ParamToggle("TrendMode","Off|On",1);
ATR_Multiplier = Param("ATR_Multiplier",2,0.1,10,0.1);
ATR_Period = Param( "ATR_Period",5,1,20,1);
tr = ATR(ATR_Period);

CalcPrice = (H+L)/2;
calcTrend_proc(ATR_Period,tr,ATR_Multiplier,TrendMode,CalcPrice);

//Plot(buffer_line_up,"\nUpTrend",ColorRGB(28,134,238),styleThick);
//Plot(buffer_line_down,"\nDownTrend",ColorRGB(205,51,51),styleThick);

Plot( 2,"UP Trend",IIf(buffer_line_up,colorGreen,colorDarkOliveGreen),styleOwnScale|styleArea|styleNoLabel, -0.5, 100 );
Plot( 4,"DOWN Trend",IIf(buffer_line_down,colorRed,colorDarkOliveGreen),styleOwnScale|styleArea|styleNoLabel, -0.5, 100 );
_SECTION_END();

_SECTION_BEGIN("ESSENTIAL TRADER TOOLS");

DayHigh = LastValue(H);
DayLow = LastValue(L);

numbars = LastValue(Cum(Status("barvisible")));
hts  = -33.5;

// Current Days Hi Lo //
THL = ParamToggle("Todays Hi Lo","Show|Hide",0);
if(THL==1)  {
  isRth = TimeNum() >= 084500 & TimeNum() <= 085959;
  isdRth = TimeNum() >= 084500 & TimeNum() <= 160000;
  aRthL = IIf(isRth, L, 1000000);
  aRthH = IIf(isdRth, H, Null);
  aRthLd = IIf(isdRth, L, 1000000);
  DayH = TimeFrameCompress( aRthH, inDaily, compressHigh );
  DayH = TimeFrameExpand( DayH, inDaily, expandFirst );
  DayL = TimeFrameCompress( aRthLd, inDaily, compressLow );
  DayL = TimeFrameExpand( DayL, inDaily, expandFirst );
  Bars = BarsSince(TimeNum() >= 94500 AND TimeNum() < 095959);//,BarIndex(),1); // AND DateNum()==LastValue(DateNum());
  x0 = BarCount-LastValue(Bars);
  x1 = BarCount-1;
  DayHline=LineArray(x0,LastValue(DayH),x1,LastValue (DayH),0);
  DayLline=LineArray(x0,LastValue(DayL),x1,LastValue (DayL),0);
  DayHlineI = LastValue (DayHline,1);
  DayLlineI = LastValue (DayLline,1);
  Plot(DayHline,"DayH",colorYellow,styleBar|styleNoRescale|styleNoTitle);
  Plot(DayLline,"DayL",colorYellow,styleBar|styleNoRescale|styleNoTitle);
  PlotText(" Day Hi " ,     LastValue(BarIndex())-(numbars/Hts), DayHlineI  +0.05, colorYellow);
  PlotText(" Day Lo " ,     LastValue(BarIndex())-(numbars/Hts), DayLlineI  +0.05, colorYellow);
}

//Previous Days HI LO //

DayH = TimeFrameGetPrice("H", inDaily, -1);  DayHI = LastValue (DayH,1);// yesterdays high
DayL = TimeFrameGetPrice("L", inDaily, -1);  DayLI = LastValue (DayL,1);    // yesterdays low
DayC = TimeFrameGetPrice("C", inDaily, -1);     // yesterdays close
DayO = TimeFrameGetPrice("O", inDaily);         // current day open
DayH2= TimeFrameGetPrice("H", inDaily, -2);  DayH2I = LastValue (DayH2,1); // Two days before high
DayL2= TimeFrameGetPrice("L", inDaily, -2);  DayL2I = LastValue (DayL2,1);  // Two days before low
DayH3= TimeFrameGetPrice("H", inDaily, -3);  DayH3I = LastValue (DayH3,1);  // Three days before high
DayL3= TimeFrameGetPrice("L", inDaily, -3);  DayL3I = LastValue (DayL3,1);  // Three days before low

YHL = ParamToggle("Yesterday HI LO","Show|Hide",0);
if(YHL==1) {
  Plot(DayL,"YL",colorTurquoise,styleDots|styleNoLine|styleNoRescale|styleNoTitle);
  Plot(DayH,"YH",colorTurquoise,styleDots|styleNoLine|styleNoRescale|styleNoTitle);
  PlotText(" YH " ,     LastValue(BarIndex())-(numbars/Hts), DayHI, colorTurquoise);
  PlotText(" YL " ,     LastValue(BarIndex())-(numbars/Hts), DayLI, colorTurquoise);
}

TDBHL = ParamToggle("2/3Days before HI LO","Show|Hide",0);
if(TDBHL==1) {
  Plot(DayL2,"2DBL",colorTurquoise,styleDots|styleNoLine|styleNoRescale|styleNoTitle);
  Plot(DayH2,"2DBH",colorTurquoise,styleDots|styleNoLine|styleNoRescale|styleNoTitle);
  Plot(DayL3,"3DBL",colorTurquoise,styleDots|styleNoLine|styleNoRescale|styleNoTitle);
  Plot(DayH3,"3DBH",colorTurquoise,styleDots|styleNoLine|styleNoRescale|styleNoTitle);
  PlotText(" 2DBH " ,   LastValue(BarIndex())-(numbars/Hts), DayH2I, colorTurquoise);
  PlotText(" 2DBL " ,   LastValue(BarIndex())-(numbars/Hts), DayL2I, colorTurquoise);
  PlotText(" 3DBH " ,   LastValue(BarIndex())-(numbars/Hts), DayH3I, colorTurquoise);
  PlotText(" 3DBL " ,   LastValue(BarIndex())-(numbars/Hts), DayL3I, colorTurquoise);
}

// Pivot Levels //
PP = (DayL + DayH + DayC)/3;  PPI = LastValue (PP,1);   // Pivot
R1  =  (PP * 2) - DayL;       R1I = LastValue (R1,1);   // Resistance 1
S1  =  (PP * 2)  - DayH;      S1I = LastValue (S1,1);   // Support 1
R2  =  PP + R1 - S1;          R2I = LastValue (R2,1);   // Resistance 2
S2  =  PP - R1 + S1;          S2I = LastValue (S2,1);   // Support 2
R3  =  PP + R2 - S1;          R3I = LastValue (R3,1);   // Resistance 3
S3  =  PP - R2 + S1;          S3I = LastValue (S3,1);   // Support 3

ppl = ParamToggle("Pivot Levels","Show|Hide",0);
if(ppl==1)  {
  Plot(PP, "PP",colorYellow,styleDots|styleNoLine|styleNoRescale|styleNoTitle);
  Plot(R1, "R1",colorOrange,styleDots|styleNoLine|styleNoRescale|styleNoTitle);
  Plot(S1, "S1",colorLime,styleDots|styleNoLine|styleNoRescale|styleNoTitle);
  Plot(R2, "R2",colorOrange,styleDots|styleNoLine|styleNoRescale|styleNoTitle);
  Plot(S2, "S2",colorLime,styleDots|styleNoLine|styleNoRescale|styleNoTitle);
  Plot(R3, "R3",colorOrange,styleDots|styleNoLine|styleNoRescale|styleNoTitle);
  Plot(S3, "S3",colorLime,styleDots|styleNoLine|styleNoRescale|styleNoTitle);

  PlotText(" Pivot ",  LastValue(BarIndex())-(numbars/Hts), PPI, colorYellow);
  PlotText(" R1 " ,    LastValue(BarIndex())-(numbars/Hts), R1I, colorOrange);
  PlotText(" S1 " ,    LastValue(BarIndex())-(numbars/Hts), S1I, colorLime);
  PlotText(" R2 " ,    LastValue(BarIndex())-(numbars/Hts), R2I, colorOrange);
  PlotText(" S2 " ,    LastValue(BarIndex())-(numbars/Hts), S2I, colorLime);
  PlotText(" R3 " ,    LastValue(BarIndex())-(numbars/Hts), R3I, colorOrange);
  PlotText(" S3 " ,    LastValue(BarIndex())-(numbars/Hts), S3I, colorLime);
}

// Mid pivots

MIDR1 = (PP+R1)/2;	MIDR1I = LastValue (MIDR1,1);   // Mid Resistance 1
MIDR2 = (R1+R2)/2;	MIDR2I = LastValue (MIDR2,1);   // Mid Resistance 2
MIDR3 = (R2+R3)/2;	MIDR3I = LastValue (MIDR3,1);   // Mid Resistance 3
MIDS1 = (PP+S1)/2;	MIDS1I = LastValue (MIDS1,1);   // Mid Support 1
MIDS2 = (S1+S2)/2;	MIDS2I = LastValue (MIDS2,1);   // Mid Support 2
MIDS3 = (S2+S3)/2;	MIDS3I = LastValue (MIDS3,1);   // Mid Support 3

mp = ParamToggle("Mid Pivots","Show|Hide",0);
if(mp==1)  {
  Plot(PP, "PP",colorYellow,styleDots|styleNoLine|styleNoRescale|styleNoTitle);
  Plot(MIDR1, "MIDR1",colorOrange,styleDots|styleNoLine|styleNoRescale|styleNoTitle);
  Plot(MIDR2, "MIDR2",colorOrange,styleDots|styleNoLine|styleNoRescale|styleNoTitle);
  Plot(MIDR3, "MIDR3",colorOrange,styleDots|styleNoLine|styleNoRescale|styleNoTitle);
  Plot(MIDS1, "MIDS1",colorLime,styleDots|styleNoLine|styleNoRescale|styleNoTitle);
  Plot(MIDS2, "MIDS2",colorLime,styleDots|styleNoLine|styleNoRescale|styleNoTitle);
  Plot(MIDS3, "MIDS3",colorLime,styleDots|styleNoLine|styleNoRescale|styleNoTitle);

  PlotText(" Pivot" ,    LastValue(BarIndex())-(numbars/Hts), PPI, colorYellow);
  PlotText(" MIDR1" ,    LastValue(BarIndex())-(numbars/Hts), MIDR1I, colorOrange);
  PlotText(" MIDR2" ,    LastValue(BarIndex())-(numbars/Hts), MIDR2I, colorOrange);
  PlotText(" MIDR3" ,    LastValue(BarIndex())-(numbars/Hts), MIDR3I, colorOrange);
  PlotText(" MIDS1" ,    LastValue(BarIndex())-(numbars/Hts), MIDS1I, colorLime);
  PlotText(" MIDS2" ,    LastValue(BarIndex())-(numbars/Hts), MIDS2I, colorLime);
  PlotText(" MIDS3" ,    LastValue(BarIndex())-(numbars/Hts), MIDS3I, colorLime);
}

// Camerilla Levels //

rg = (DayH - DayL);

H5=DayC+1.1*rg;     H5I = LastValue (H5,1);
H4=DayC+1.1*rg/2;   H4I = LastValue (H4,1);
H3=DayC+1.1*rg/4;   H3I = LastValue (H3,1);
H2=DayC+1.1*rg/6;   H2I = LastValue (H2,1);
H1=DayC+1.1*rg/12;  H1I = LastValue (H1,1);
L1=DayC-1.1*rg/12;  L1I = LastValue (L1,1);
L2=DayC-1.1*rg/6;   L2I = LastValue (L2,1);
L3=DayC-1.1*rg/4;   L3I = LastValue (L3,1);
L4=DayC-1.1*rg/2;   L4I = LastValue (L4,1);
L5=DayC-1.1*rg;     L5I = LastValue (L5,1);

pcl = ParamToggle("Camerilla Levels","Show|Hide",0);
if(pcl==1)  {
   Plot(H5,"",colorOrange,styleDots|styleNoLine|styleNoRescale|styleNoTitle);
   Plot(H4,"",colorOrange,styleDots|styleNoLine|styleNoRescale|styleNoTitle);
   Plot(H3,"",colorOrange,styleDots|styleNoLine|styleNoRescale|styleNoTitle);
   Plot(H2,"",colorOrange,styleDots|styleNoLine|styleNoRescale|styleNoTitle);
   Plot(H1,"",colorOrange,styleDots|styleNoLine|styleNoRescale|styleNoTitle);
   Plot(L1,"",colorLime,styleDots|styleNoLine|styleNoRescale|styleNoTitle);
   Plot(L2,"",colorLime,styleDots|styleNoLine|styleNoRescale|styleNoTitle);
   Plot(L3,"",colorLime,styleDots|styleNoLine|styleNoRescale|styleNoTitle);
   Plot(L4,"",colorLime,styleDots|styleNoLine|styleNoRescale|styleNoTitle);
   Plot(L5,"",colorLime,styleDots|styleNoLine|styleNoRescale|styleNoTitle);
   PlotText(" H5" ,  LastValue(BarIndex())-(numbars/Hts), H5I, colorOrange);
   PlotText(" H4" ,  LastValue(BarIndex())-(numbars/Hts), H4I, colorOrange);
   PlotText(" H3" ,  LastValue(BarIndex())-(numbars/Hts), H3I, colorOrange);
   PlotText(" H2" ,  LastValue(BarIndex())-(numbars/Hts), H2I, colorOrange);
   PlotText(" H1" ,  LastValue(BarIndex())-(numbars/Hts), H1I, colorOrange);
   PlotText(" L1" ,  LastValue(BarIndex())-(numbars/Hts), L1I, colorLime);
   PlotText(" L2" ,  LastValue(BarIndex())-(numbars/Hts), L2I, colorLime);
   PlotText(" L3" ,  LastValue(BarIndex())-(numbars/Hts), L3I, colorLime);
   PlotText(" L4" ,  LastValue(BarIndex())-(numbars/Hts), L4I, colorLime);
   PlotText(" L5" ,  LastValue(BarIndex())-(numbars/Hts), L5I, colorLime);
}

_SECTION_END();

_SECTION_BEGIN("MPLite");
//PlotOHLC(O,H,L,C,"Price",IIf(C>O,colorGreen,colorRed),styleCandle);
//Muratt's heikin Treasure!
HaClose = (O + H + L + C)/4;
HaOpen = AMA( Ref( HaClose, -1 ), 0.5 );
HaHigh = Max( H, Max( HaClose, HaOpen ) );
HaLow = Min( L, Min( HaClose, HaOpen ) );
xDiff = (HaHigh - Halow) * 10000;
barcolor = IIf(HaClose >= HaOpen,colorGreen,colorRed);
//PlotOHLC( HaOpen, HaHigh, HaLow, HaClose, "", barcolor, styleCandle );

function Lastthursday()
{
 Daysinmonth=IIf(Month()==1 OR Month()==3 OR Month()==5 OR Month()==7 OR Month()==8 OR Month()==10 OR Month()==12,31,30);
 Daysinmonthfeb=IIf(Year()%4 == 0 AND Year()%100!=0,29,28);
 Daysinmonthfinal=IIf(Month()==2,Daysinmonthfeb,Daysinmonth);
 returnvalue=IIf(Daysinmonthfinal-Day()<7 AND DayOfWeek()==4,1,IIf(Daysinmonthfinal-Day()<8 AND DayOfWeek()==3 AND Ref(DayOfWeek(),1)!=4,1,0));
 return returnvalue;
}

FirstVisibleBar = Status( "FirstVisibleBar" );
Lastvisiblebar = Status( "LastVisibleBar" );

totalVisible=Lastvisiblebar-FirstVisibleBar;
//if(totalVisible<1500){

//Den = Param("Density", 1, 0.1, 10, 0.1);
percent=Param("Value Area", 70, 1, 100, 1);
Type=ParamList("Type","Price Profile|Volume Profile");
Period= ParamList("Base","Hourly|Daily|Weekly|Monthly|Lastthursday|Yearly",1);
x_scale=Param("Horizontal_scale", 2, 0, 10, 0.1);
EnMP2= ParamStyle("Style",styleLine|styleNoLabel,maskAll);
styleLines=styleDots;
ViewYvalues= ParamToggle("Show Yesterdays Values", "No|Yes",1);
ViewVlines= ParamToggle("Show Vertical Base Lines", "No|Yes",1);
Viewvalues= ParamToggle("Show Values", "No|Yes",0);
ViewVpoc= ParamToggle("Show Virgin POC", "No|Yes",1);
ViewTPO=ParamToggle("Show TPO Count", "No|Yes",0);

if(Period=="Hourly"){
BarsInDay = BarsSince(Hour() != Ref(Hour(), -1));Bot = TimeFrameGetPrice("L", inHourly, 0);Top = TimeFrameGetPrice("H", inHourly, 0);Vol = TimeFrameGetPrice("V", inHourly, 0);
}
if(Period=="Daily" ){//OR Interval()==3600
BarsInDay = BarsSince(Day() != Ref(Day(), -1));Bot = TimeFrameGetPrice("L", inDaily, 0);Top = TimeFrameGetPrice("H", inDaily, 0);Vol = TimeFrameGetPrice("V", inDaily, 0);
}
if(Period=="Weekly" OR Interval()==24 * 3600 ){
BarsInDay = BarsSince(DayOfWeek() < Ref( DayOfWeek(), -1 ));Bot = ValueWhen(Ref(BarsInDay,1)==1 OR BarIndex()>BarCount-2 ,LLV(L,BarsInDay),0);Top =ValueWhen(Ref(BarsInDay,1)==1 OR BarIndex()>BarCount-2,HHV(H,BarsInDay),0);Vol = TimeFrameGetPrice("V", inWeekly, 0);
}
if(Period=="Monthly"  ){
BarsInDay = BarsSince(Month() != Ref(Month(), -1));Bot = TimeFrameGetPrice("L", inMonthly, 0);Top = TimeFrameGetPrice("H", inMonthly, 0);Vol = TimeFrameGetPrice("V", inMonthly, 0);
}

if(Period=="Lastthursday"  ){
BarsInDay = BarsSince(Lastthursday()==1 AND Ref(Lastthursday(), -1)==0);Bot = ValueWhen(Ref(BarsInDay,1)==1 OR BarIndex()>BarCount-2 ,LLV(L,BarsInDay),0);Top =ValueWhen(Ref(BarsInDay,1)==1 OR BarIndex()>BarCount-2,HHV(H,BarsInDay),0);Vol = TimeFrameGetPrice("V", inMonthly, 0);
}

if(Period=="Yearly"  ){
BarsInDay = BarsSince(Year() != Ref(Year(), -1));Bot = TimeFrameGetPrice("L", inYearly, 0);Top = TimeFrameGetPrice("H", inYearly, 0);Vol = TimeFrameGetPrice("V", inYearly, 0);
}

Range =  Top-Bot;
coverage=LastValue(ATR(10));

den=(coverage/10);

//multiplier=IIf(round(totalVisible)>500,IIf(round(totalVisible)>1000,3,2),1);

multiplier=IIf(round(totalVisible)/300<1,1,round(totalVisible)/300);


if(ViewVlines==1)
{
Plot(BarsInDay==0, "", ParamColor("Base Line Color",colorDarkGrey), styleHistogram | styleOwnScale | styleLine | styleNoLabel);
}


relTodayRange = 0;
x=0;
basey=0;
basex=0;
newday=0;
total=0;
shiftup=0;
shiftdn=0;
Line=Null;
Voloumeunit=0;


for (  i = FirstVisibleBar; i <Lastvisiblebar AND i<BarCount-1 ; i++  )
{
	if(BarsInDay[i]==0)
	{t=BarsInDay[i-1];


		//////////////////////////////////
poc=0;pocj=0;
midrange = int(relTodayRange/2)+1;


for (j=1; j<= relTodayRange+1 ; j++)
	{
		if(poc < x[j])
		{
		poc=x[j]; pocj=j;}
		else if(poc == x[j])
			{
			if (abs(midrange-j)< abs(midrange-pocj)){
			poc = x[j]; pocj = j;
			}
		}

	}

for ( n = 1; n <= relTodayRange; n++ )
	{
		total[n]=x[n]+total[n-1];
	}

Value_area=(total[relTodayRange]*percent)/100;


for ( a = 1; a <= relTodayRange; a++ )
{
	if(pocj-a>0 AND pocj+a<relTodayRange)
	{
		if(poc+total[pocj+a]-total[pocj]+(total[pocj]-poc)-total[pocj-(a+1)]>=Value_area) {shiftup=a; shiftdn=a; break;}
	 	}
		else if(pocj-a<1 )
		{
		if(poc+total[pocj+a]-total[pocj]+(total[pocj]-poc)>=Value_area){shiftup=a; shiftdn=pocj; break;}
   		}
		else if(pocj+a>relTodayRange )
		{
		if(poc+total[relTodayRange]-total[pocj]+(total[pocj]-poc)-total[pocj-(a+1)] >=Value_area){shiftup=floor(relTodayRange)-pocj; shiftdn=a+1; break;}
   	}
}


if(ViewVpoc==1)
{
Virginpoc=basey+pocj*den;
newi=0;
for( j = i+1; j <= (BarCount - 1) ; j++ )
if( L[j] < Virginpoc AND H[j]>Virginpoc )
{newi=j;break;}
else{newi=BarCount;}
vishycolor=IIf(BarCount%2==0,colorRed,colorBlue);
Plot(LineArray(basex[i],basey+pocj*den,newi,basey+pocj*den),"",vishycolor,styleLine|styleNoRescale);
//Plot(LineArray(basex[i],basey+pocj*den,newi,basey+pocj*den),"",colorYellow,styleLine|styleNoRescale);
}

Vah = LineArray(baseX[i], baseY+(pocj+shiftup)*den, i, baseY+(pocj+shiftup)*den);
Val = LineArray(baseX[i], baseY+(pocj-shiftdn)*den, i, baseY+(pocj-shiftdn)*den);
pocline=LineArray(basex,basey+pocj*den,basex[i]+poc,basey+pocj*den);

//Plot(Vah,"",ParamColor("Color_VAH_Line", colorBlueGrey),styleLine|styleNoRescale);
//Plot(Val,"",ParamColor("Color_VAL_Line", colorBlueGrey),styleLine|styleNoRescale);

Vahn = LineArray(i, baseY+(pocj+shiftup)*den, i+t, baseY+(pocj+shiftup)*den);
pocn = LineArray(i, baseY+(pocj)*den, i+t, baseY+(pocj)*den);
Valn = LineArray(i, baseY+(pocj-shiftdn)*den, i+t, baseY+(pocj-shiftdn)*den);

Plot(pocline,"",ParamColor("Color_POC_Line",colorYellow),styleLine|styleNoRescale|styleNoLabel);

if(ViewYvalues==1)
{
Plot(Vahn,"",ParamColor("YVAH",colorBrightGreen),styleDashed|styleNoRescale);
Plot(Valn,"",ParamColor("YVAL",colorYellow),styleDashed|styleNoRescale);
Plot(pocn,"",ParamColor("YPOC",colorDarkRed),styleDashed|styleNoRescale);

}
//PlotOHLC(Vahn,Vahn,Valn,Valn,"",colorPink,styleCloud|styleOwnScale);


if(ViewTPO==1)
{
nnn=HHV(H,BarsInDay);
PlotText(""+(total[relTodayRange]-total[pocj]),basex[i],nnn[i],colorLightGrey);
PlotText(""+(total[pocj-1]),basex[i],basey-den,colorLightGrey);
}

if(Viewvalues==1)
{
PlotText(""+((basey+pocj*den)),baseX[i],basey+pocj*den,colorWhite,colorDarkGrey);
PlotText(""+((baseY+(pocj+shiftup)*den)),baseX[i],baseY+(pocj+shiftup)*den,colorWhite,colorDarkGrey);
PlotText(""+((baseY+(pocj-shiftdn)*den)),baseX[i],baseY+(pocj-shiftdn)*den,colorWhite,colorDarkGrey);
}


for (p = 0; p <= relTodayRange+1; p=p+multiplier)
{
	if(P>0){
	line = LineArray(baseX, baseY+(p)*Den, baseX+x[p], baseY+(p)*Den);

	}

	Plot(line,"",IIf(p>(pocj+shiftup),ParamColor("Color_Above_VA",  colorDarkRed),IIf(p<=(pocj+shiftup)AND p>=(pocj-shiftdn),ParamColor("Color_VA", colorDarkBlue),ParamColor("Color_Below_VA",   colorDarkRed))) , EnMP2);


}

Plot(pocline,"",ParamColor("Color_POC_Line",colorDarkRed),styleLine|styleNoRescale);

///////////////////

basex=0;
		x=0;
		Basex=i;
		baseY=Bot[i];
		relTodayRange=Range[i]/Den;
		Voloumeunit=Vol[i]/LastValue(BarsInDay);

	}

	for (j=0; j<= relTodayRange ; j++)
	{
		if (L[i] <= Bot[i]+j*Den AND H[i] >= Bot[i]+j*Den  )
		{
			if(Type=="Price Profile"){x[j]=(x[j])+x_scale;}
			else if(Type=="Volume Profile"){x[j]=x[j]+round(V[i]/Voloumeunit)+1;}
		}
	}
}


//////////////////////////////////
poc=0;pocj=0;
midrange = int(relTodayRange/2)+1;

for (j=1; j<= relTodayRange+1 ; j++)
	{
		if(poc < x[j])
		{
		poc=x[j]; pocj=j;}
		else if(poc == x[j])
			{
			if (abs(midrange-j)< abs(midrange-pocj)){
			poc = x[j]; pocj = j;
			}
		}

	}

for ( n = 1; n <= relTodayRange; n++ )
	{
		total[n]=x[n]+total[n-1];
	}

Value_area=(total[relTodayRange]*percent)/100;


for ( a = 1; a <= relTodayRange; a++ )
{
	if(pocj-a>0 AND pocj+a<relTodayRange)
	{
		if(poc+total[pocj+a]-total[pocj]+(total[pocj]-poc)-total[pocj-(a+1)]>=Value_area) {shiftup=a; shiftdn=a; break;}
	 	}
		else if(pocj-a<1 )
		{
		if(poc+total[pocj+a]-total[pocj]+(total[pocj]-poc)>=Value_area){shiftup=a; shiftdn=pocj; break;}
   		}
		else if(pocj+a>relTodayRange )
		{
		if(poc+total[relTodayRange]-total[pocj]+(total[pocj]-poc)-total[pocj-(a+1)] >=Value_area){shiftup=floor(relTodayRange)-pocj; shiftdn=a+1; break;}
   	}
}

Vah = LineArray(baseX[i], baseY+(pocj+shiftup)*den, i, baseY+(pocj+shiftup)*den);
Val = LineArray(baseX[i], baseY+(pocj-shiftdn)*den, i, baseY+(pocj-shiftdn)*den);
pocline=LineArray(basex,basey+pocj*den,basex[i]+poc,basey+pocj*den);

if(ViewTPO==1)
{
PlotText(""+(total[relTodayRange]-total[pocj]),basex[i],top[i],colorLightGrey);
PlotText(""+(total[pocj-1]+x_scale),basex[i],basey-den,colorLightGrey);
}

if(Viewvalues==1)
{
PlotText(""+((basey+pocj*den)),baseX[i],basey+pocj*den,colorWhite,colorDarkGrey);
PlotText(""+((baseY+(pocj+shiftup)*den)),baseX[i],baseY+(pocj+shiftup)*den,colorWhite,colorDarkGrey);
PlotText(""+((baseY+(pocj-shiftdn)*den)),baseX[i],baseY+(pocj-shiftdn)*den,colorWhite,colorDarkGrey);
}

for (p = 0; p <= relTodayRange+1; p=p+multiplier)
{
	line = LineArray(baseX, baseY+p*Den, baseX+x[p], baseY+p*Den);

	Plot(line,"",IIf(p>(pocj+shiftup),ParamColor("Color_Above_VA",  colorGrey40),IIf(p<=(pocj+shiftup)AND p>=(pocj-shiftdn),ParamColor("Color_VA", colorBlueGrey),ParamColor("Color_Below_VA",colorGrey40))),EnMP2);

	Plot(pocline,"",ParamColor("Color_POC_Line",colorYellow),styleLine|styleNoRescale|styleNoLabel);
}
_SECTION_END();
11 comments
Leave Comment
Please login here to leave a comment.
ALL the additional tools are enabled via Parameters – It also includes “Linear Regression Channel” as an optional parameter for enablement on the chart.
I GOT ERROR. TO MANY PLOT CALLS ANY HELP
Zoom in until it works. No other way around it except to use an older version.
Hello sir.
Lin: 217 col 14 warning 501
Lin: 218 col 218 warning 502
Please rectify and post sir
thanks and regards
Sir,your AFL looks very good.I think it works very good in nifty trading.For SAR 20 points S/L will be fine.20 points S/L ok pl tell.
THANKS for your post.
Sir,your AFL looks very good.I think it works very good in nifty trading.For SAR 20 points S/L will be fine.20 points S/L ok pl tell.
THANKS for your post.
I WANT TO MAKE ONE AFL PLS SUGEST ME WHO CAN WRITE AFL MY ID WAS rajaswamym@yah00.c0m
Sir,, i got Error in ur afl,, pls suggest me
Sir the lower indicators are not included in the AFL, please advise
Can i use this mcx commodity market?
Just tested the code on new Amibroker 6.2, due to the MPlite coding standard, it reports error. So to make the AFL work on new Amibroker, just drop the last MPLite section all together. Hope this helps!