ATR Trading System for Amibroker (AFL)
soydan almost 16 years ago Amibroker (AFL)
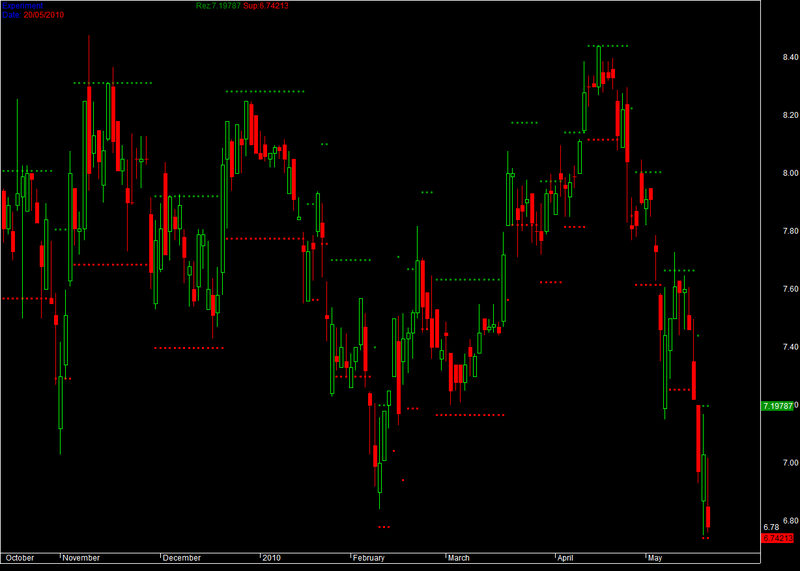
Atr Trading System with Support and resistance
Screenshots
Indicator / Formula
Copy & Paste Friendly
_SECTION_BEGIN("ATR Trading System");

  k=1; /* multiplication factor*/
  n=10; /*period*/
  f=ATR(n);


    R[0] = Close[0];

    S[0] = C[0];
for( i = 11; i < BarCount; i++ )
{


   R[i]=R[i-1];
   S[i]=S[i-1];

    if ( C[i-1] >R[i-1] )
{
       r[i] = C[i-1]+k*f[i-1];
       s[i]= C[i-1]-k*f[i-1];
}
    if ( C[i-1] <S[i-1] )
{
       r[i] = C[i-1]+k*f[i-1];
       s[i]= C[i-1]-k*f[i-1];
}


Buy=Close>R;
Sell=Close<S;

Cump=IIf(Close>R,1,0);
Vanz=IIf(Close<S,1,0);
}
Plot(Close,"Close",colorBlack,styleCandle);
Plot(R, "Rez:",colorGreen,styleDots|styleNoLine);
Plot(S, "Sup:",colorRed,styleDots|styleNoLine);


Buy = ExRem( Buy, Sell ); //Elimina semnalele buy consecutive
Sell = ExRem( Sell, Buy ); //Elimina semnalele sell consecutive

shape = Buy * shapeUpArrow + Sell * shapeDownArrow;

fig=Cump*shapeHollowUpArrow + Vanz*shapeHollowDownArrow;

PlotShapes( fig, IIf( Cump, colorPaleGreen  , colorPink), 0, IIf( Cump, Low-50, High+50)); //Pentru a vizualiza semnalele consecutive eliminate de ExRem
PlotShapes( shape, IIf( Buy, colorGreen, colorRed ), 0, IIf( Buy, Low-50, High+50));

AlertIf( Buy, "", "Experiment", 1 );
AlertIf( Sell, "", "Experiment",2);

GraphXSpace = 3;

Title=EncodeColor(colorBlue)+"Experiment"+EncodeColor(colorBlack)+ " Open:"+O+" High:"+H+" Low:"+L+" Close:"+C+EncodeColor(colorGreen)+" Rez:"+R+EncodeColor(colorRed)+" Sup:"+S+EncodeColor(colorBlue)+
	" \nDate: "+EncodeColor(colorRed)+Date();
_SECTION_END();
0 comments
Leave Comment
Please login here to leave a comment.