market thermometer for Amibroker (AFL)
titus almost 16 years ago Amibroker (AFL)
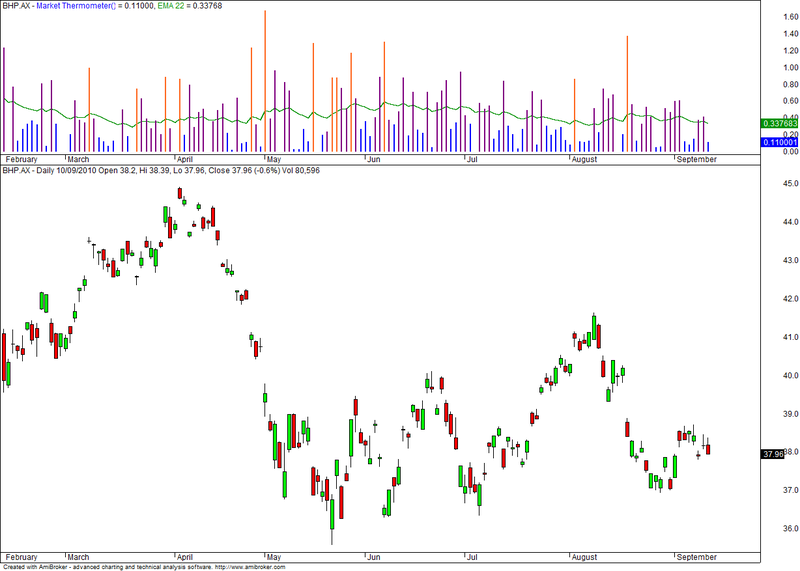
You need to use this indicator below your price graph for good results.
Screenshots
Indicator / Formula
Copy & Paste Friendly
_SECTION_BEGIN("Market Thermometer");

H1 = Ref(H, -1);
L1 = Ref(L, -1);

T = IIf(H<H1 AND L>L1, 0, IIf(H-H1>L1-L, H-H1, L1-L));

Val1 = H-H1;
Val2 = L1-L;
Val = IIf(Val1>Val2, Val1, Val2) ;


Avgval = Median(Val, 22);

color= IIf (Val < Avgval, colorBlue, IIf(Val >= Avgval AND Val < Avgval * 3, colorViolet, IIf(Val > Avgval * 3, colorOrange, colorViolet)));


Plot(T, _DEFAULT_NAME(), color, styleHistogram | styleThick);
P = ParamField("Price field",-1);
Periods = Param("Periods", 22, 2, 200, 1, 10 );

Plot( EMA( P, Periods ), "EMA 22", colorGreen, styleThick);

_SECTION_END();
1 comments
Leave Comment
Please login here to leave a comment.
Hai, Good Color, but how to use ?, each color indicate ?? pls