Khichadi_R50_R3212.afl for Amibroker (AFL)
kartmer555 almost 16 years ago Amibroker (AFL)
Wonderful AFL added completely
R4:-Fib SMA Added
R3:-support & Resistance Code Added
R2:- Buy & Sell Notes Removed
R1: – SMA 5,6 cross over changed to fib 5,8,13,21,34,55,89 system
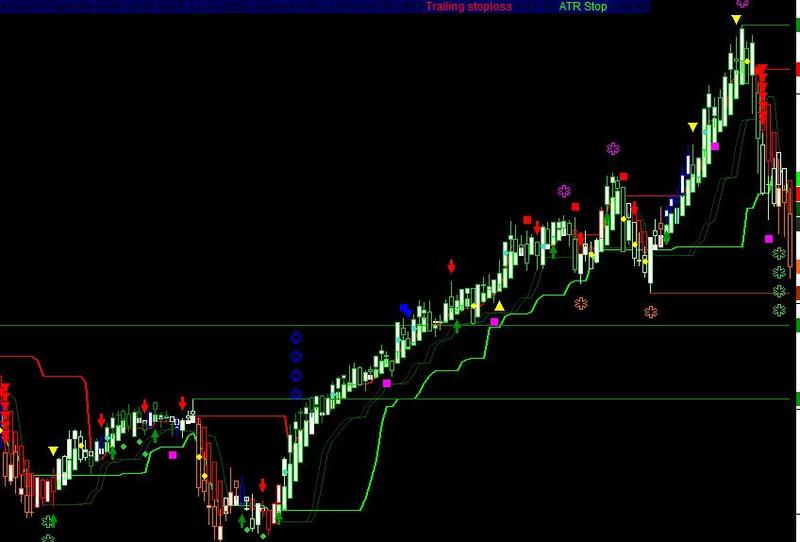
Screenshots
Indicator / Formula
Copy & Paste Friendly
//R30:-PlotOHLC( 1.2*HaOpen, 1.2*HaHigh, 1.2*HaLow, 1.2*HaClose, "", color, styleCandle,styleThick ); was as it is except factor 1.3*
//R5:- Wonderful AFL added completely
//R4:-Fib SMA Added
//R3:-support & Resistance Code Added
//R2:- Buy & Sell Notes Removed
//R1: - SMA 5,6 cross over changed to fib 5,8,13,21,34,55,89 system
//Volume Price Analysis AFL - VPA Version 1.2
//AFL by Karthikmarar. Detailed explanation available at www.vpanalysis.blogspot.com
//Added Exploration - detailed 241209
//====================================================================================
_SECTION_BEGIN("Volume Price Analysis - V.1.2");
SetChartOptions(0,chartShowArrows|chartShowDates);
//=======================================================================================
DTL=Param("Linear regression period",60,10,100,10);
wbf=Param("WRB factor",1.5,1.3,2.5,.1);
nbf=Param("NRB factor",0.7,0.3,0.9,0.1);
TL=LinRegSlope(MA(C, DTL),2);
Vlp=Param("Volume lookback period",30,20,300,10);
Vrg=MA(V,Vlp);
St = StDev(Vrg,Vlp);
Vp3 = Vrg + 3*st;
Vp2 = Vrg + 2*st;;
Vp1 = Vrg + 1*st;;
Vn1 = Vrg -1*st;
Vn2 = Vrg -2*st;
rg=(H-L);
arg=Wilders(rg,30);
wrb=rg>(wbf*arg);
nrb=rg<(nbf*arg);
Vl=V<Ref(V,-1) AND V<Ref(V,-2);
upbar=C>Ref(C,-1);
dnbar=C<Ref(C,-1);
Vh=V>Ref(V,-1) AND Ref(V,-1)>Ref(V,-2);
Cloc=C-L;
x=rg/Cloc;
x1=IIf(Cloc==0,arg,x);
Vb=V>Vrg OR V>Ref(V,-1);
ucls=x1<2;
dcls=x1>2;
mcls=x1<2.2 AND x1>1.8 ;
Vlcls=x1>4;
Vhcls=x1<1.35;
j=MA(C,5);
TLL=LinRegSlope(j,40) ;
Tlm=LinRegSlope(j,15) ;
tls=LinRegSlope(j,5);
mp=(H+L)/2;
_SECTION_END();
//==========================================================================================
_SECTION_BEGIN("VSA");
utbar=wrb AND dcls AND tls>0 ;
utcond1=Ref(utbar,-1) AND dnbar ;
utcond2=Ref(utbar,-1) AND dnbar AND V>Ref(V,-1);
utcond3=utbar AND V> 2*Vrg;
trbar=Ref(V,-1)>Vrg  AND Ref(upbar,-1) AND Ref(wrb,-1) AND dnbar AND dcls AND wrb AND tll>0 AND H==HHV(H,10);
Hutbar=Ref(upbar,-1) AND Ref(V,-1)>1.5*Vrg AND dnbar AND dcls AND NOT wrb AND NOT utbar;
Hutcond=Ref(Hutbar,-1) AND dnbar AND dcls AND NOT utbar;
tcbar=Ref(upbar,-1) AND H==HHV(H,5)AND dnbar AND (dcls OR mcls) AND V>vrg AND NOT wrb AND NOT Hutbar ;
Scond1=(utcond1 OR utcond2 OR utcond3) ;
Scond2=Ref(scond1,-1)==0;
scond=scond1 AND scond2;
stdn0= tll<0 AND V>Ref(V,-1) AND Ref(dnbar,-1) AND upbar AND (ucls OR mcls) AND tls<0 AND tlm<0;
stdn= V>Ref(V,-1) AND Ref(dnbar,-1) AND upbar AND (ucls OR mcls) AND tls<0 AND tlm<0;
stdn1= tll<0 AND V>(vrg*1.5) AND Ref(dnbar,-1) AND upbar AND (ucls OR mcls)AND tls<0 AND tlm<0;
stdn2=tls<0 AND Ref(V,-1)<Vrg  AND upbar AND vhcls AND V>Vrg;
bycond1= stdn OR stdn1;
bycond= upbar  AND Ref(bycond1,-1);
stvol= L==LLV(L,5)  AND (ucls OR mcls) AND V>1.5*Vrg AND tll<0;
ndbar=upbar AND nrb AND Vl  AND dcls ;
nsbar=dnbar AND nrb AND Vl  AND dcls ;
nbbar= C>Ref(C,-1) AND Vl AND nrb AND x1<2;
nbbar= IIf(C>Ref(C,-1) AND V<Ref(V,-1) AND V<Ref(V,-2) AND x1<1.1,1,0);
lvtbar= vl AND L<Ref(L,-1) AND ucls;
lvtbar1= V<Vrg AND L<Ref(L,-1) AND ucls AND tll>0 AND tlm>0 AND wrb;
lvtbar2= Ref(Lvtbar,-1) AND upbar AND ucls;
dbar= V>2*Vrg AND dcls AND upbar AND tls>0 AND tlm>0 AND NOT Scond1 AND NOT utbar;
eftup=H>Ref(H,-1) AND L>Ref(L,-1) AND C>Ref(C,-1) AND C>=((H-L)*0.7+L) AND rg>arg AND V>Ref(V,-1);
eftupfl=Ref(eftup,-1) AND (utbar OR utcond1 OR utcond2 OR utcond3);
eftdn=H<Ref(H,-1) AND L<Ref(L,-1) AND C<Ref(C,-1) AND  C<=((H-L)*0.25+L) AND rg>arg AND V>Ref(V,-1);
_SECTION_END();
//=======================================================================================================================
_SECTION_BEGIN("Chart");
Vcolor=IIf(tls>0 AND tlm>0 AND tll>0,colorLime,IIf(tls>0 AND tlm>0 AND tll<0,colorGreen,
IIf(tls>0 AND tlm<0 AND tll<0,colorPaleGreen,IIf(tls<0 AND tlm<0 AND tll<0,colorRed,IIf(tls<0 AND tlm>0 AND tll>0,colorPaleGreen,
IIf(tls<0 AND tlm<0 AND tll>0,colorOrange,colorBlue))))));
GraphXSpace = 5;

//PlotOHLC( Open,  High,  Low,  Close, "", vcolor, styleCandle | styleThick  );
PlotOHLC( Open,  High,  Low,  Close, "", vcolor, styleCandle | styleNoDraw );


_SECTION_END();
//============================================================================================================================
// commentary
_SECTION_BEGIN("Commentary");
Vpc= utbar OR utcond1 OR utcond2 OR utcond3 OR stdn0 OR stdn1 OR stdn2 OR stdn OR lvtbar1 OR Lvtbar OR Lvtbar2 OR Hutbar OR Hutcond OR ndbar OR stvol OR tcbar;

if( Status("action") == actionCommentary )
(
printf ( "=========================" +"\n"));
printf ( "VOLUME PRICE ANALYSIS" +"\n");
printf ( "www.vpanalysis.blogspot.com" +"\n");
printf ( "=========================" +"\n");
printf ( Name() + " - " +Interval(2) +  "  - " + Date() +" - " +"\n"+"High-"+H+"\n"+"Low-"+L+"\n"+"Open-"+O+"\n"+
"Close-"+C+"\n"+ "Volume= "+ WriteVal(V)+"\n");
WriteIf(Vpc,"=======================","");
WriteIf(Vpc,"VOLUME ANALYSIS COMMENTARY:\n","");

WriteIf(utbar , "Up-thrusts are designed to catch stops and to mislead as many traders as possible.
They are normally seen after there has been weakness in the background. The market makers know that the
market is weak, so the price is marked up to catch stops, encourage traders to go long in a weak market,
AND panic traders that are already Short into covering their very good position.","")+
WriteIf(utcond3,"This upthrust bar is at high volume.This is a sure sign of weakness. One may even seriously
consider ending the Longs AND be ready to reverse","")+WriteIf(utbar OR utcond3," Also note that A wide spread
down-bar that appears immediately after any up-thrust, tends to confirm the weakness (the market makers are
locking in traders into poor positions).
With the appearance of an upthrust you should
certainly be paying attention to your trade AND your stops. On many upthrusts you will find that the market will
'test' almost immediately.","")+WriteIf(utcond1 , "A wide spread down bar following a Upthrust Bar.
This confirms weakness. The Smart Money is locking in Traders into poor positions","");
WriteIf(utcond2 , "Also here the volume is high( Above Average).This is a sure sign of weakness. The Smart Money is
locking in Traders into poor positions","")+WriteIf(stdn, "Strength Bar. The stock has been in a down Trend. An upbar
with higher Volume closing near the High is a sign of strength returning. The downtrend is likely to reverse soon. ","")+
WriteIf(stdn1,"Here the volume is very much above average. This makes this indication more stronger. ","")+
WriteIf(bycond,"The previous bar saw strength coming back. This upbar confirms strength. ","")+
WriteIf(Hutbar," A pseudo Upthrust. This normally appears after an Up Bar with above average volume. This looks like an upthrust bar
closing down near the Low. But the Volume is normally Lower than average. this is a sign of weakness.If the Volume is High then weakness
increases. Smart Money is trying to trap the retailers into bad position. ","")+
WriteIf(Hutcond, "A downbar after a pseudo Upthrust Confirms weakness. If the volume is above average the weakness is increased. ","")+
WriteIf(Lvtbar2,"The previous bar was a successful Test of supply. The current bar is a upbar with higher volume. This confirms strength","")+
WriteIf(dbar,"A wide range, high volume bar in a up trend closing down is an indication the Distribution is in progress. The smart money
is Selling the stock to the late Comers rushing to Buy the stock NOT to be Left Out Of a Bullish move. ","")+
WriteIf(Lvtbar2,"The previous bar was a successful Test of supply. The current bar is a upbar with higher volume. This confirms strength","")+
WriteIf(tcbar,"The stock has been moving up on high volume. The current bar is a Downbar with high volume. Indicates weakness and probably end of the up move","")+
WriteIf(eftup,"Effort to Rise bar. This normally found in the beginning of a Markup Phase and is bullish sign.These may be found at the top of an Upmove as the Smart money makes a
last effort to move the price to the maximum","")+
WriteIf(eftdn,"Effort to Fall bar. This normally found in the beginning of a Markdown phase.","")+

WriteIf(nsbar,"No Supply. A no supply bar indicates supply has been removed and the Smart money can markup the price. It is better to wait for confirmation","")+
WriteIf(stvol,"Stopping Volume. This will be an downbar during a bearish period closing towards the Top accompanied by High volume.
A stopping Volume normally indicates that smart money is absorbing the supply which is a Indication that they are Bullishon the MArket.
Hence we Can expect a reversal in the down trend. ","")+
WriteIf(ndbar, "No Demand
Brief Description:
Any up bar which closes in the middle OR Low, especially if the Volume has fallen off,
is a potential sign of weakness.

Things to Look Out for:
if the market is still strong, you will normally see signs of strength in the next few bars,
which will most probably show itself as a:
* Down bar with a narrow spread, closing in the middle OR High.
* Down bar on Low Volume.","");
_SECTION_END();
_SECTION_BEGIN("Advanced Trend Lines");
ShowSR   = ParamToggle("Show Vert S/R","No|Yes", 0);
SRPer    = Param("S/R Percentage", 3, 1);
SRBack   = Param("S/R Back", 5, 1);
function GetXSupport(Lo, Percentage, Back)
{
 return ((BarCount - 1) - LastValue(TroughBars(Lo, Percentage,Back)));
}
function GetYSupport(Lo, Percentage, Back)
{
 return (LastValue(Trough(Lo, Percentage, back)));
}

function GetXResistance(Hi, Percentage, Back)
{
 return ((BarCount - 1) -LastValue(PeakBars(Hi, Percentage, Back)));
}
function GetYResistance(Hi, Percentage, Back)
{
 return (LastValue(Peak(Hi, Percentage, Back)));
}

if(ShowSR)
{
    for(i=1; i<=SRBack; i++)
    {
        x0 = GetXSupport(L, SRPer, i);
        x1 = BarCount-1;
        y0 = GetYSupport(L, SRPer, i);
        x = LineArray(x0, y0, x1, y0, 0);
        Plot(x, "", IIf(LastValue(C) > x, colorGreen, colorRed), styleLine|styleDashed|styleThick);
        x0 = GetXResistance(H, SRPer, i);
        y0 = GetYResistance(H, SRPer, i);
        x = LineArray(x0, y0, x1, y0, 0);
        Plot(x, "", IIf(LastValue(C) > x, colorGreen, colorRed), styleLine|styleDashed|styleThick);

    }
}


//=========================================================================================
//ploting the chart shapes
_SECTION_BEGIN("Indications");
PlotShapes( shapeSmallSquare*(utbar AND NOT scond) , colorRed, 0, H, 10 );
PlotShapes(shapeSmallCircle*trbar, colorBlue, 0, H, 20 );

PlotShapes(shapeSmallDownTriangle*scond, colorRed, 0, H,-20);
PlotShapes(shapeSmallDownTriangle*scond, colorRed, 0, H,-30);
PlotShapes(shapeSmallDownTriangle*scond, colorRed, 0, H,-40);
PlotShapes(shapeSmallDownTriangle*scond, colorRed, 0, H,-50);
PlotShapes(shapeSmallDownTriangle*scond, colorRed, 0, H,-60);
PlotShapes(shapeSmallDownTriangle*scond, colorRed, 0, H,-70);

PlotShapes(shapeHollowStar*stdn, colorLime, 0, L, -20 );
PlotShapes(shapeHollowStar*stdn, colorLime, 0, L, -40 );
PlotShapes(shapeHollowStar*stdn, colorLime, 0, L, -60 );
PlotShapes(shapeHollowStar*stdn, colorLime, 0, L, -80 );


PlotShapes(shapeSmallSquare*stdn1, colorLime, 0, L, -20 );
PlotShapes(shapeSmallSquare*lvtbar1, colorLime, 0, L, -20 );
PlotShapes(shapeSmallUpTriangle*lvtbar2, colorYellow, 0, L, -20 );
PlotShapes(shapeHollowSmallCircle*stvol, colorLime, 0, L, -10 );
PlotShapes(shapeSmallUpTriangle*bycond, colorLime, 0, L, -20 );
PlotShapes(shapeSmallSquare*(Hutbar) , colorBlue, 0, H, 10 );
PlotShapes(shapeSmallDownTriangle*(Hutcond) , colorBlue, 0, H, -20 );
PlotShapes(shapeSmallDownTriangle*tcbar , colorYellow, 0, H, -20 );
PlotShapes(shapeSmallUpTriangle*stdn2, colorAqua, 0, L, -20 );
PlotShapes(shapeSmallSquare*(dbar) , colorBlue, 0, H, 10 );
PlotShapes(shapeSmallSquare*lvtbar, colorCustom12, 0, L, -20);

//PlotShapes(shapeSmallSquare*(ndbar) , colorBlue, 0, H, 10 );
PlotShapes(shapeHollowStar*(ndbar) , colorBlue, 0, H, 20 );
PlotShapes(shapeHollowStar*(ndbar) , colorBlue, 0, H, 40 );
PlotShapes(shapeHollowStar*(ndbar) , colorBlue, 0, H, 60 );
PlotShapes(shapeHollowStar*(ndbar) , colorBlue, 0, H, 80 );

PlotShapes(shapeSmallCircle*nsbar, colorLime, 0, L, -20 );
PlotShapes(shapeSmallCircle*eftup, colorTurquoise, 0, mp, 0 );
PlotShapes(shapeSmallCircle*eftdn, colorYellow, 0, mp, 0 );

_SECTION_END();
//======================================================================================================================================================================================
//TITLE
_SECTION_BEGIN("Title");
if( Status("action") == actionIndicator )
(
Title = EncodeColor(colorWhite)+ "Volume Price Analysis" + " - " +  Name() + " - " + EncodeColor(colorRed)+ Interval(2) + EncodeColor(colorWhite) +
 "  - " + Date() +" - " +EncodeColor(colorLime)+ "Volume= "+WriteVal(V)+"--"+EncodeColor(colorYellow)+"\n"+
WriteIf (utbar, " An Upthrust Bar. A sign of weakness. ","")+
WriteIf (utcond1, " A downbar after an Upthrust. Confirm weakness. ","")+
WriteIf (utcond2 AND NOT utcond1, " A High Volume downbar after an Upthrust. Confirm weakness.","")+
WriteIf (utcond3, "This upthrust at very High Voume, Confirms weakness","")+
WriteIf (stdn1, "Strength seen returning after a down trend. High volume adds to strength. ","")+
WriteIf (stdn0 AND NOT stdn, "Strength seen returning after a down trend. ","")+
WriteIf (stdn AND NOT stdn1, "Strength seen returning after a long down trend. ","")+
WriteIf (Lvtbar, "Test for supply. ","")+
WriteIf (Lvtbar2, "An Upbar closing near High after a Test confirms strength. ","")+
WriteIf (bycond, "An Upbar closing near High. Confirms return of Strength. ","")+
WriteIf (dbar, "A High Volume Up Bar closing down in a uptrend shows Distribution. ","")+
WriteIf (Hutbar, "Psuedo UpThrust.   A Sign of Weakness. ","")+
WriteIf (Hutcond, "A Down Bar closing down after a Pseudo Upthrust confirms weakness. ","")+
WriteIf (Lvtbar1, "Test for supply in a uptrend. Sign of Strength. ","")+
WriteIf (stdn2, "High volume upbar closing on the high indicates strength. ","")+
WriteIf (Tcbar, "High volume Downbar after an upmove on high volume indicates weakness. ","")+
WriteIf (ndbar, "No Demand. A sign of Weakness. ","")+
WriteIf (nsbar, "No Supply. A sign of Strength. ","")+
WriteIf (eftup, "Effort to Rise. Bullish sign ","")+
WriteIf (eftdn, "Effort to Fall. Bearish sign ","")+
WriteIf (eftupfl, "Effort to Move up has failed. Bearish sign ","")+
WriteIf (stvol, "Stopping volume. Normally indicates end of bearishness is nearing. ","")+
("\n Volume: ")+WriteIf(V>Vp2,EncodeColor(colorLime)+"Very High",WriteIf(V>Vp1,EncodeColor(colorLime)+" High",WriteIf(V>Vrg,EncodeColor(colorLime)+"Above Average",
WriteIf(V<Vrg AND V>Vn1,EncodeColor(colorRed)+"Less than Average",WriteIf(V<Vn1,"Low","")))))+
(EncodeColor(colorYellow)+"      Spread: ")+WriteIf(rg >(arg*2),EncodeColor(colorLime)+" Wide",WriteIf(rg>arg,EncodeColor(colorLime)+" Above Average",EncodeColor(colorRed)+" Narrow"))+
(EncodeColor(colorYellow)+"      Close:  ")+WriteIf(Vhcls,EncodeColor(colorLime)+"Very High",WriteIf(ucls,EncodeColor(colorLime)+"High",WriteIf(mcls,EncodeColor(colorYellow)+"Mid",
WriteIf(dcls,EncodeColor(colorRed)+"Down","Very Low"))))+
("\n Trend: ")+WriteIf(tls>0,EncodeColor(colorLime)+"  Short Term-UP",EncodeColor(colorRed)+"  Short Term-Down")+
WriteIf(tlm>0,EncodeColor(colorLime)+"         MID Term-UP",EncodeColor(colorRed)+"        Mid Term-Down")+
WriteIf(tll>0,EncodeColor(colorLime)+"       Long Term-Up",EncodeColor(colorRed)+"         Long term-Down"));
_SECTION_END();
//============================================================================================================================================================================================
_SECTION_BEGIN("Exploration");

Lq=V;
Lqok=Lq>100000;

Filter=  (utbar OR utcond2 OR utcond3 OR stdn OR stdn0 OR stdn1 OR stdn2 OR eftup OR eftdn OR stvol OR Hutbar OR Hutcond
         OR tcbar OR Lvtbar2 OR dbar OR bycond) AND Lqok;
tcolor = IIf(stdn OR stdn1, 42,IIf(bycond , colorPaleGreen,IIf(stdn2, colorPaleGreen,
        IIf(utbar OR utcond1, 33,IIf(utcond2 OR utcond3, 25,IIf(eftup, colorLime,IIf(eftdn,colorRed,IIf(hutbar,33,
        IIf(hutcond,colorOrange,IIf(stdn0,42,IIf(stvol,42,IIf(utcond1,colorOrange,
        IIf(dbar,33,IIf(tcbar,33,colorWhite))))))))))))));

AddTextColumn(
WriteIf (utbar, "Sign of weakness. ",
WriteIf (utcond1, "Confirmed weakness. ",
WriteIf (utcond2 AND NOT utcond1, "Confirms weakness.",
WriteIf (utcond3, "Confirms weakness",
WriteIf (stdn1, "strength returning. ",
WriteIf (stdn0 AND NOT stdn, "strength returning. ",
WriteIf (stdn AND NOT stdn1, "strength returning. ",
WriteIf (Lvtbar, "Test for supply. ",
WriteIf (Lvtbar2, "confirms strength. ",
WriteIf (bycond, "Confirms return of Strength. ",
WriteIf (dbar, "Distribution. ",
WriteIf (Hutbar, "Sign of Weakness. ",
WriteIf (Hutcond, "Confirms weakness. ",
WriteIf (Lvtbar1, "Sign of Strength. ",
WriteIf (stdn2, "Indicates strength. ",
WriteIf (Tcbar, "Indicates weakness. ",
WriteIf (ndbar, "A sign of Weakness. ",
WriteIf (stvol, "End of bearishnees near ",
WriteIf (eftup, "Bullish sign ",
WriteIf (eftdn, "Bearish sign ",
WriteIf (eftupfl, "Bearish sign ",""))))))))))))))))))))), "Signal" , 1, colorDefault, tcolor,110);

AddTextColumn(
WriteIf (utbar, " An Upthrust Bar. ",
WriteIf (utcond1, " A downbar after an Upthrust. ",
WriteIf (utcond2 AND NOT utcond1, " A High Volume downbar after an Upthrust.",
WriteIf (utcond3, "This upthrust at very High Voume.",
WriteIf (stdn1, "Strength seen returning after a down trend. ",
WriteIf (stdn0 AND NOT stdn, "Strength seen returning after a down trend. ",
WriteIf (stdn AND NOT stdn1, "Strength seen returning after a long down trend. ",
WriteIf (Lvtbar, "Test for supply. ",
WriteIf (Lvtbar2, "An Upbar closing near High. ",
WriteIf (bycond, "An Upbar closing near High.",
WriteIf (dbar, "A High Volume Up Bar closing down in a uptrend. ",
WriteIf (Hutbar, "Psuedo UpThrust. ",
WriteIf (Hutcond, "A Down Bar closing down after a Pseudo Upthrust. ",
WriteIf (Lvtbar1, "Test for supply in a uptrend. ",
WriteIf (stdn2, "High volume upbar closing on the high. ",
WriteIf (Tcbar, "High volume Downbar after an upmove on high volume. ",
WriteIf (ndbar, "No Demand. A sign of Weakness. ",
WriteIf (stvol, "Stopping volume. ",
WriteIf (eftup, "Effort to Rise. ",
WriteIf (eftdn, "Effort to Fall.  ",
WriteIf (eftupfl, "Effort to Move up has failed. ",""))))))))))))))))))))), "Condition" , 1, colorDefault, tcolor,250);
 _SECTION_END ();

//=====================================================================
//background stock name (works only on Amibroker version 5.00 onwards.
//=====================================================================
_SECTION_BEGIN("Name");
GfxSetOverlayMode(1);
GfxSelectFont("Tahoma", Status("pxheight")/6 );
GfxSetTextAlign( 6 );// center alignment
//GfxSetTextColor( ColorRGB( 200, 200, 200 ) );
GfxSetTextColor( ColorHSB( 42, 42, 42 ) );
GfxSetBkMode(0); // transparent
GfxTextOut( Name(), Status("pxwidth")/2, Status("pxheight")/12 );
GfxSelectFont("Tahoma", Status("pxheight")/12 );
GfxTextOut( "VPA", Status("pxwidth")/2, Status("pxheight")/3 );
GfxSelectFont("Tahoma", Status("pxheight")/36 );
GfxTextOut( "www.vpanalysis.blogspot.com", Status("pxwidth")/2, Status("pxheight")/2 );
_SECTION_END();
//=====================================================================
//=====================================================================
//=====================================================================
//=====================================================================
//=====================================================================
//=====================================================================
//=====================================================================
//=====================================================================
//=====================================================================
//SMA 5,6 Crossover
//=====================================================================
_SECTION_BEGIN("SMA5-20 Golden& Death X");
Buy = Cross( MA( Close, 5 ), MA( Close, 8 ) );
Buy2 = Cross( MA( Close, 5 ), MA( Close, 13 ) );
Buy3 = Cross( MA( Close, 5 ), MA( Close, 21 ) );
Buy4 = Cross( MA( Close, 5 ), MA( Close, 34 ) );
Buy5 = Cross( MA( Close, 5 ), MA( Close, 55 ) );
Buy6 = Cross( MA( Close, 5 ), MA( Close, 89 ) );
Sell = Cross( MA( Close, 8 ), MA( Close, 5 ) );
PlotShapes(IIf(Sell==1, shapeDownArrow, shapeNone), colorRed, 0,High, Offset=-15);
PlotShapes(IIf(Buy==1, shapeUpArrow , shapeNone), colorGreen, 0,Low, Offset=-15);
_SECTION_END();

//===================================================================
//=====================================================================
//=====================================================================
//=====================================================================
//=====================================================================
//=====================================================================
//=====================================================================
//=====================================================================
//=====================================================================
//=====================================================================
//Pivot_Finder Code
_SECTION_BEGIN("Pivot_Finder");
/* **********************************

Code to automatically identify pivots

********************************** */

// -- what will be our lookback range for the hh and ll?
farback=Param("How Far back to go",100,0,5000,10);
nBars = Param("Number of bars", 12, 5, 40);


GraphXSpace=7;

// -- Create 0-initialized arrays the size of barcount

aHPivs = H - H;

aLPivs = L - L;

// -- More for future use, not necessary for basic plotting

aHPivHighs = H - H;

aLPivLows = L - L;

aHPivIdxs = H - H;

aLPivIdxs = L - L;

nHPivs = 0;

nLPivs = 0;

lastHPIdx = 0;

lastLPIdx = 0;

lastHPH = 0;

lastLPL = 0;

curPivBarIdx = 0;

// -- looking back from the current bar, how many bars

// back were the hhv and llv values of the previous

// n bars, etc.?

aHHVBars = HHVBars(H, nBars);

aLLVBars = LLVBars(L, nBars);

aHHV = HHV(H, nBars);

aLLV = LLV(L, nBars);

// -- Would like to set this up so pivots are calculated back from

// last visible bar to make it easy to "go back" and see the pivots

// this code would find. However, the first instance of

// _Trace output will show a value of 0

aVisBars = Status("barvisible");

nLastVisBar = LastValue(Highest(IIf(aVisBars, BarIndex(), 0)));

_TRACE("Last visible bar: " + nLastVisBar);

// -- Initialize value of curTrend

curBar = (BarCount-1);

curTrend = "";

if (aLLVBars[curBar] <

aHHVBars[curBar]) {

curTrend = "D";

}

else {

curTrend = "U";

}

// -- Loop through bars. Search for

// entirely array-based approach

// in future version

for (i=0; i<farback; i++) {

curBar = (BarCount - 1) - i;

// -- Have we identified a pivot? If trend is down...

if (aLLVBars[curBar] < aHHVBars[curBar]) {

// ... and had been up, this is a trend change

if (curTrend == "U") {

curTrend = "D";

// -- Capture pivot information

curPivBarIdx = curBar - aLLVBars[curBar];

aLPivs[curPivBarIdx] = 1;

aLPivLows[nLPivs] = L[curPivBarIdx];

aLPivIdxs[nLPivs] = curPivBarIdx;

nLPivs++;

}

// -- or current trend is up

} else {

if (curTrend == "D") {

curTrend = "U";

curPivBarIdx = curBar - aHHVBars[curBar];

aHPivs[curPivBarIdx] = 1;

aHPivHighs[nHPivs] = H[curPivBarIdx];

aHPivIdxs[nHPivs] = curPivBarIdx;

nHPivs++;

}

// -- If curTrend is up...else...

}

// -- loop through bars

}

// -- Basic attempt to add a pivot this logic may have missed

// -- OK, now I want to look at last two pivots. If the most

// recent low pivot is after the last high, I could

// still have a high pivot that I didn't catch

// -- Start at last bar

curBar = (BarCount-1);

candIdx = 0;

candPrc = 0;

lastLPIdx = aLPivIdxs[0];

lastLPL = aLPivLows[0];

lastHPIdx = aHPivIdxs[0];

lastHPH = aHPivHighs[0];

if (lastLPIdx > lastHPIdx) {

// -- Bar and price info for candidate pivot

candIdx = curBar - aHHVBars[curBar];

candPrc = aHHV[curBar];

if (

lastHPH < candPrc AND

candIdx > lastLPIdx AND

candIdx < curBar) {


// -- OK, we'll add this as a pivot...

aHPivs[candIdx] = 1;

// ...and then rearrange elements in the

// pivot information arrays

for (j=0; j<nHPivs; j++) {

aHPivHighs[nHPivs-j] = aHPivHighs[nHPivs-

(j+1)];

aHPivIdxs[nHPivs-j] = aHPivIdxs[nHPivs-(j+1)];

}

aHPivHighs[0] = candPrc ;

aHPivIdxs[0] = candIdx;

nHPivs++;

}

} else {


// -- Bar and price info for candidate pivot

candIdx = curBar - aLLVBars[curBar];

candPrc = aLLV[curBar];

if (

lastLPL > candPrc AND

candIdx > lastHPIdx AND

candIdx < curBar) {


// -- OK, we'll add this as a pivot...

aLPivs[candIdx] = 1;

// ...and then rearrange elements in the

// pivot information arrays

for (j=0; j<nLPivs; j++) {

aLPivLows[nLPivs-j] = aLPivLows[nLPivs-(j+1)];

aLPivIdxs[nLPivs-j] = aLPivIdxs[nLPivs-(j+1)];

}

aLPivLows[0] = candPrc;

aLPivIdxs[0] = candIdx;

nLPivs++;

}

}

// -- Dump inventory of high pivots for debugging


for (k=0; k<nHPivs; k++) {

_TRACE("High pivot no. " + k

+ " at barindex: " + aHPivIdxs[k] + ", "

+ WriteVal(ValueWhen(BarIndex()==aHPivIdxs[k],

DateTime(), 1), formatDateTime)

+ ", " + aHPivHighs[k]);

}


// -- OK, let's plot the pivots using arrows

PlotShapes(

IIf(aHPivs==1, shapeHollowStar, shapeNone), colorCustom12, 0, H, 25);

PlotShapes(

IIf(aLPivs==1, shapeHollowStar , shapeNone), colorOrange, 0, L, -20);

_SECTION_BEGIN("Graphics");
GrpPrm=Param("Graphic Space",1,0,10);
GraphXSpace=GrpPrm;
_SECTION_END();

//Buy See Signals given below are removed in Khichadi_R2
//_SECTION_BEGIN("MABIUTS");
//SetChartOptions(0,chartShowArrows|chartShowDates);
//_N(Title = StrFormat("{{NAME}} - {{INTERVAL}} {{DATE}} Open %g, Hi %g, Lo %g, Close %g (%.1f%%) Vol " +WriteVal( V, 1.0 ) +" {{VALUES}}", O, H, L, C, SelectedValue( ROC( C, 1 )) ));

//Buy=EMA(C,13)>EMA(EMA(C,13),9) AND Cross (C,Peak(C,5,1));
//Sell=Cross (EMA(EMA(C,13),9),EMA(C,13));
//MYcolor = IIf( EMA(C,13)>EMA(EMA(C,13),9) AND C>Peak(C,2,1), colorGreen, IIf(EMA(C,13)>EMA(EMA(C,13),9) AND C<Peak(C,2,1),colorBlue, colorOrange ));

//PlotOHLC( Open, High, Low, Close, "", Mycolor, styleBar );

//shape = Buy * shapeHollowStar + Sell * shapeHollowStar;
//PlotShapes( shape, IIf( Buy, colorGreen, colorRed ),0, IIf( Buy, Low, High ) );

//GraphXSpace = 5;
//dist = 1.5*ATR(10);

//for( i = 0; i < BarCount; i++ )
//{
//if( Buy[i] ) PlotText( "Buy\n@" + C[ i ], i, L[ i ]-dist[i], colorGreen );
//if( Sell[i] ) PlotText( "Sell\n@" + C[ i ], i, H[ i ]+dist[i], colorRed);
//}


//_SECTION_END();

//===================================================================
//=====================================================================
//=====================================================================
//              Support & Resistance
//=====================================================================
//=====================================================================
//=====================================================================
_SECTION_BEGIN("Sup / Res Lines");
SRswitch = ParamToggle("Sup / Res Lines","On,Off");
CHLswitch = ParamToggle("Hi Low / Close","Hi Low,Close");
NoLines = Param("No of Lines",3,1,10,1);
Sen = Param("Sensitivity",5,1,100,1);

Rcolor=ParamColor( "Res Color", colorGreen );
Rstyle=ParamStyle( "Res Style", styleLine );

Scolor=ParamColor( "Sup Color", colorBrown );
Sstyle=ParamStyle( "Sup Style", styleLine );

y=0;
x=0;

for( i = 1; i < NoLines+1 ; i++ )
{
Y[i]=LastValue(Peak(IIf(CHLswitch,C,H),Sen,i));
x[i]=BarCount - 1 - LastValue(PeakBars(IIf(CHLswitch,C,H),Sen,i));
Line = LineArray( x[i], y[i], Null, y[i], 1 );
Plot( IIf(SRswitch,Null,Line), "", Rcolor, Rstyle );

Y[i]=LastValue(Trough(IIf(CHLswitch,C,L),Sen,i));
x[i]=BarCount - 1 - LastValue(TroughBars(IIf(CHLswitch,C,L),Sen,i));
Line = LineArray( x[i], y[i], Null, y[i], 1 );
Plot( IIf(SRswitch,Null,Line), "", Scolor, Sstyle );
}
_SECTION_END();

//=====================================================================
//=====================================================================
//================= Fibonacci SMA ====================
//=====================================================================
//=====================================================================
/*
_SECTION_BEGIN("5MA");
P = ParamField("Price field",-1);
Periods = Param("Periods", 5, 2, 200, 1 );
Plot( MA( P, Periods ), _DEFAULT_NAME(), ParamColor( "Color", colorCycle ), ParamStyle("Style") );
_SECTION_END();


_SECTION_BEGIN("8MA");
P = ParamField("Price field",-1);
Periods = Param("Periods", 8, 2, 200, 1 );
Plot( MA( P, Periods ), _DEFAULT_NAME(), ParamColor( "Color", colorCycle ), ParamStyle("Style") );
_SECTION_END();


_SECTION_BEGIN("13MA");
P = ParamField("Price field",-1);
Periods = Param("Periods", 13, 2, 200, 1 );
Plot( MA( P, Periods ), _DEFAULT_NAME(), ParamColor( "Color", colorCycle ), ParamStyle("Style") );
_SECTION_END();


_SECTION_BEGIN("21MA");
P = ParamField("Price field",-1);
Periods = Param("Periods", 21, 2, 200, 1 );
Plot( MA( P, Periods ), _DEFAULT_NAME(), ParamColor( "Color", colorCycle ), ParamStyle("Style") );
_SECTION_END();


_SECTION_BEGIN("34MA");
P = ParamField("Price field",-1);
Periods = Param("Periods", 34, 2, 200, 1 );
Plot( MA( P, Periods ), _DEFAULT_NAME(), ParamColor( "Color", colorCycle ), ParamStyle("Style") );
_SECTION_END();


_SECTION_BEGIN("55MA");
P = ParamField("Price field",-1);
Periods = Param("Periods", 55, 2, 200, 1 );
Plot( MA( P, Periods ), _DEFAULT_NAME(), ParamColor( "Color", colorCycle ), ParamStyle("Style") );
_SECTION_END();


_SECTION_BEGIN("89MA");
P = ParamField("Price field",-1);
Periods = Param("Periods", 89, 2, 200, 1 );
Plot( MA( P, Periods ), _DEFAULT_NAME(), ParamColor( "Color", colorCycle ), ParamStyle("Style") );
_SECTION_END();

_SECTION_BEGIN("144MA");
P = ParamField("Price field",-1);
Periods = Param("Periods", 144, 2, 200, 1 );
Plot( MA( P, Periods ), _DEFAULT_NAME(), ParamColor( "Color", colorCycle ), ParamStyle("Style") );
_SECTION_END();

_SECTION_BEGIN("233MA");
P = ParamField("Price field",-1);
Periods = Param("Periods", 233, 2, 200, 1 );
Plot( MA( P, Periods ), _DEFAULT_NAME(), ParamColor( "Color", colorCycle ), ParamStyle("Style") );
_SECTION_END();
*/

//=====================================================================
//=====================================================================
//                          Wonderful AFL
//====================================================================
//=====================================================================

/*_SECTION_BEGIN("Background_Setting");
SetChartBkGradientFill( ParamColor("BgTop", colorBlack),
ParamColor("BgBottom", colorBlack),ParamColor("titleblock",colorDarkTeal ));
_SECTION_END();*/


_SECTION_BEGIN("The_Beast_2");
SetBarsRequired(10000,10000); /* this ensures that the charts include all bars
AND NOT just those on screen */
Prd1=Param("ATR Period 1-20",4,1,20,1);//{Default = 4 Because most traders use 5}
Prd2=Param("LookBack Period 1-20",7,1,20,1);//{Default = 11 Because most traders use 10}
//{Green} {Start Long position when Close>Green}
Green=HHV(LLV(L,Prd1)+ATR(Prd1),Prd2);
//{Red} {Stop loss when Close<Red}
RED=LLV(HHV(H,Prd1)-ATR(Prd1),Prd2);


HaClose =EMA((O+H+L+C)/4,3);
HaOpen = AMA( Ref( HaClose, -1 ), 0.5 );
HaHigh = Max( H, Max( HaClose, HaOpen ) );
HaLow = Min( L, Min( HaClose, HaOpen ) );
Color = IIf(C>Green ,colorBrightGreen,IIf(C < RED,colorRed,colorWhite));

PlotOHLC( HaOpen, HaHigh, HaLow, HaClose, "", color, styleCandle,styleThick );

//PlotOHLC( 1.15*Open, 1.15*High, 1.15*Low, 1.15*Close, "", color, styleLine,styleThick );


SetChartOptions(0,chartShowArrows|chartShowDates);
_N(Title = StrFormat("{{NAME}} - {{INTERVAL}} {{DATE}} Open %g, Hi %g, Lo %g, Close %g (%.1f%%) Vol " +WriteVal( V, 1.0 ) +" {{VALUES}}", O, H, L, C, SelectedValue( ROC( C, 1 )) ));


_SECTION_END();

_SECTION_BEGIN("Trailing_Stop_Short");
stoplossPercentage = Param("Stoploss Percentage", 5, 2, 10);
lookbackPeriod = Param("Lookback period", 10, 5, 30);
Plot(HHV(C,lookbackPeriod) - HHV(C,lookbackPeriod) * (stoplossPercentage / 100), "Trailing stoploss", ParamColor( "Color", colorCycle ),ParamStyle("Style",styleLine|Stylehidden ,maskAll));
_SECTION_END();

_SECTION_BEGIN("Trailing_Stop_Long");
//ATR  values can be changed from 1 to 3 multiplications in steps of 0.25
//ATR value or the last low pivot value  can be selected. This feature can be overridden from the parameter window. It is recommended to use only ATR Value
//Choice of plots line or just dots from the parameter window is also possible
mf = Param("ATR multiplier",3,1,3,0.25);
ap=Param("ATR Period",10,5,30,1);
Lb=Param("Lookback Period",20,10,40,1);
ps=ParamToggle("Use last low pivot","Use,Dont",1);
//Thick = Param("Thick" , 0.02, 0.01, 0.2, 0.01);

t1=HHV(C,Lb);
t2=(mf*ATR(ap));
t3=Trough(C,2,1);
t4=t1-t2;
t5=Min(t4,t3);

if(ps)
	{
	t6 = t1-t2;
		}
else
	{
	t6=t5;
	}

initial=t6;
stop[ 0 ] = Close[ 0 ];

for( i = 1 ; i < BarCount; i++)
{
if( Close[ i ] > stop[ i - 1])
{
temp = t6[ i ];
if( temp > stop[ i - 1 ] ) stop[ i ] = temp;
else stop[ i ] = stop[ i - 1 ];
}
else
stop[ i ] = initial[ i ];

}

Plot(stop,"ATR Stop",ParamColor( "Color", colorSeaGreen ),ParamStyle("Style",styleLine|Stylehidden,maskAll));

_SECTION_END();

_SECTION_BEGIN("Trailing_Lines");
Plot(LLV(HHV(H,5)-ATR(5),8),"",ParamColor( "Color Line 0", colorDarkGreen ),ParamStyle("Style Line 0",styleLine,maskAll));
Plot(LLV(HHV(H,5)-ATR(5),7),"",ParamColor( "Color Line 1", colorDarkGrey),ParamStyle("styleLine 1",styleLine,maskAll));
Plot(LLV(HHV(H,5)-ATR(5),6),"",ParamColor( "Color Line 2", colorDarkGrey ),ParamStyle("Style Line 2",styleLine,maskAll));
Plot(LLV(HHV(H,5)-ATR(5),5),"",ParamColor( "Color Line 3", colorDarkGrey),ParamStyle("Style Line 3",styleLine,maskAll));
Plot(LLV(HHV(H,5)-ATR(5),4),"",ParamColor( "Color Line 4", colorDarkGrey ),ParamStyle("Style Line 4",styleLine,maskAll));
Plot(LLV(HHV(H,5)-ATR(5),3),"",ParamColor( "Color Line 5", colorDarkYellow ),ParamStyle("Style Line 5",styleLine,maskAll));

_SECTION_END();


//=====================================================================
//=====================================================================

//background=========================================
_SECTION_BEGIN("Background_Setting");
SetChartBkGradientFill( ParamColor("BgTop", colorBlack),
ParamColor("BgBottom", colorBlack),ParamColor("titleblock",colorDarkTeal ));
_SECTION_END();

//=====================================================================
//* ATR Study:  */

Exclude = MA(V,50)<200 ;
MaxGraph = 12;
//Graph0 = C;
Graph0Color = 1;
Graph0Style = 64;

BuyOffSet = 18;//Optimize("BuyOffSet",18,15,20,1);
SellOffset = BuyOffSet;//Optimize("SellOffset",2,2,14,2);
RegLength = 5;//Optimize("RegLength",5, 2,11,2);
BuyATRPeriod = 2;//Optimize("BuyATRPeriod",2,2,5,1);
SellATRPeriod = BuyATRPeriod;//Optimize("SellATRPeriod",4,2,11,2);
ATRMultiplier = 1;//Optimize("ATRMultiplier",1,0.7,1.25,.05);


Graph8 = HHV(H-ATRMultiplier*ATR(BuyATRPeriod),BuyOffset);   /* RED */
Graph9 = LLV(L+ATRMultiplier*ATR(SellATRPeriod),SellOffset);  /*  GREEN */

Graph8Style=Graph9Style = 5;
Graph9Color=  5;  /* 5 is green */
Graph8Color = 4;  /* 4 is red */
/*
ticker = 0.0;//Optimize("Tickerk",0,0,1,0.125);
/*
Buy = Cross(C,Graph8) AND C>Graph9 AND LinRegSlope(EMA(C,17),2)>0;
Sell = Cross(Graph8,C) AND LinRegSlope(C,2)<0;
Buy = ExRem(Buy,Sell);
Sell = ExRem(Sell,Buy);
BuyStop = Ref(Graph8,-1)+ ticker;
BuyPrice = Max(BuyStop,Low);
SellStop= Ref(Graph8,-1);   //IIf(Cross(Graph8,C),Ref(Graph8,-1),0);
SellPrice = Min( SellStop, High )- ticker;

//ApplyStop(2,3,Optimize("TrailingStop",15,0,20,5),1);

Filter=   (Buy OR Sell)      ;
NumColumns = 8;
Column0 =  IIf(Buy==1,1,IIf(Sell==1,-1,0) );
Column0Format = 1.0;
Column0Name = "Long/Sell";
Column1 = C;
Column1Name = "Close       ";
Column1Format = 1.2;
Column2 = MA(V,17);
Column2Name = "17 Ma Vol   ";
Column2Format = 1.0;
Column3 = MA(C,17)/MA(C,50);
Column3Name = "% 17/50 ";
Column3Format = 1.2;
Column3Format = 1.2;
Column4= MA(C,17);
Column4Name="17 C ma";
Column4Format = 1.2;
Column5= MA(C,50);
Column5Name="50 C ma";
Column5Format = 1.2;

Column6= BuyPrice;
Column6Name="BuyPrice";
Column6Format = 1.2;
Column7= SellPrice;
Column7Name="Sellprice";
Column7Format = 1.2;


//=====================================================================
4 comments
Leave Comment
Please login here to leave a comment.
it has mistake line number 488: if (aLLVBars[curBar] < aHHVBars[curBar]) {
if i scan or explore
Thank youi very much!
scan show some error out of rande like
Error message below
if (aLLVBars[curBar] < aHHVBars[curBar]) {
detail error message generated by amibroker
Error 10. Subscript out of range. You must not access array elements outside 0..(BarCount-1) range
Occurs when you attempt to access array elements with subscripts below 0 (zero) or above BarCount-1.
// incorrect
for( bar = 0; bar < BarCount; bar++ )
{
a[ bar ] = C[ bar – 1]; // when i == 0 we are accessing C[-1] which is wrong
}
// correct
for( bar = 0; bar < BarCount; bar++ )
{
if( bar > 0 )
a[ bar ] = C[ bar – 1 ]; // only access C[ i – 1 ] when i is greater than zero
else
a[ bar ] = C[ 0 ];
}
One of most common mistakes is using hard coded upper limit of for loop and assuming that all symbols have enough quotes.
For example:
MyPeriod = 10;
for( i = 0; i < MyPeriod; i++ ) // WRONG ! this assumes that you always have at least 10 quotes !
{
// … do something
}
This will always fail on symbols that have less quotes than 10 and it may also fail if you zoom your chart in so less than 10 quotes are actually displayed on the chart.
To ensure error-free operation you must always check for upper index being LESS than BarCount, like shown in the code below:
MyPeriod = 10;
for( i = 0; i < MyPeriod AND i < BarCount; i++ ) // CORRECT – added check for upper bound
{
// … do something
}
Alternativelly you can enter the loop only when there are enough bars, like shown in this code:
MyPeriod = 10;
if( MyPeriod <= BarCount ) // CORRECT – check if there are enough bars to run the loop
{
for( i = 0; i < MyPeriod; i++ )
{
// … do something
}
}
PLESE RECTIFY IT ,IT SEEMS VERY GOOD AFL
THANKS
I agree but it works fine for me but if you upload the fixed/improved version to the pasties section I will update this one.
not working