PRA TTS v1.1 for Amibroker (AFL)
jaipal7786 over 13 years ago Amibroker (AFL)
technical added—-
1-tow type exploration(mrkt exp or buy/sell switch in prameter),(switchable)
2-trend line added,(switchable),
3-regreshion trend,(switchable),
4-buy/sell label,(switchable)/
5-accurate buy/sell signal,
6-magnified price two type(switchable)
7-pivot already…..
enjoy trading..
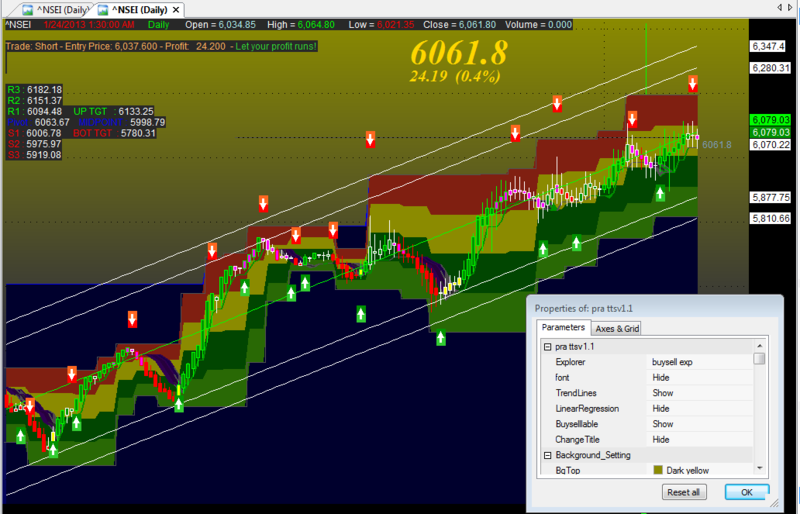
Screenshots
Indicator / Formula
Copy & Paste Friendly
Explorer= ParamToggle("Explorer","buysell exp|market exp",1);
font = ParamToggle("font","Show|Hide",1);
TrendLines= ParamToggle("TrendLines","Show|Hide",0);
LinearRegression= ParamToggle("LinearRegression","Show|Hide",0);
Buyselllable= ParamToggle("Buyselllable","Show|Hide",0);
ChangeTitle= ParamToggle("ChangeTitle","Show|Hide",1);
_SECTION_BEGIN("Background_Setting");
SetChartBkGradientFill( ParamColor("BgTop", colorDarkYellow),
ParamColor("BgBottom", colorDarkTeal),ParamColor("titleblock",colorDarkGrey ));
SetChartBkColor(colorTeal); // color of outer border
_SECTION_END();

SetChartOptions(0,chartShowArrows | chartShowDates);
if(TrendLines==1)
{
_SECTION_BEGIN("Trend Lines");
p1 = Param("TL 1 Periods", 20, 5, 50, 1);
p2 = Param("TL 2 Periods", 5, 3, 25, 1);
TL1 = LinearReg(C, p1);
TL2 = EMA(TL1, p2);
Col1 = IIf(TL1 > TL2, ParamColor("TL Up Colour", colorGreen), ParamColor("TL Dn Colour", colorRed));
Plot(TL1, "TriggerLine 1", Col1, styleLine|styleThick|styleNoLabel);
Plot(TL2, "TriggerLine 2", Col1, styleLine|styleThick|styleNoLabel);
_SECTION_END();
}
//================================================End Chart Configuration===============================================================================

if(font==0)
{
_SECTION_BEGIN("Name");
GfxSetOverlayMode(0);
GfxSelectFont("Tahoma", Status("pxheight")/8 );
GfxSetTextAlign( 6 );// center alignment
GfxSetTextColor( ColorHSB( 42, 42, 42 ) );
GfxSetBkMode(0); // transparent
GfxTextOut( Name(), Status("pxwidth")/2, Status("pxheight")/12 );
GfxSelectFont("Tahoma", Status("pxheight")/18 );
GfxTextOut("" , Status("pxwidth")/2, Status("pxheight")/4 );
GfxSelectFont("Tahoma", Status("pxheight")/18 );
GfxSelectFont("Tahoma", Status("pxheight")/36 );
GfxTextOut( "", Status("pxwidth")/2, Status("pxheight")/3 );
_SECTION_END();

//Magfied Market Price
FS=Param("Font Size",72,11,100,1);
GfxSelectFont("Times New Roman", FS, 700, True );
GfxSetBkMode(0); // transparent
GfxSetTextColor( ColorHSB( 42, 42, 42 ) );
Hor=Param("Horizonta Position",615,1,1200,1);
Ver=Param("Vertica Position",152,1,830,1);
GfxTextOut(""+C, Hor , Ver );
YC=TimeFrameGetPrice("C",inDaily,-1);
DD=Prec(C-YC,2);
xx=Prec((DD/YC)*100,2);
FS2=Param("Font Size2",35,11,100,1);
GfxSelectFont("Times New Roman", FS2,11, 700, True );
GfxSetBkMode( colorBlack );
Hor1=Param("Horizontal Position",615,1,1200,1);
Ver1=Param("Vertical Position",188,1,830,1);
GfxSetTextColor( ColorHSB( 42, 42, 42 ) );
GfxTextOut(""+DD+"  ("+xx+"%)", Hor1 , Ver1+45 );
}
else
{{
//Magfied Market Price
fse=Param("Font Sizee",35,11,100,1);
GfxSelectFont("Times New Roman", fse, 700, True );
GfxSetBkMode( colorGold );
GfxSetTextColor( ParamColor("Color",colorGold) );
Hora=Param("Horizontal Positiona",525,1,1200,1);
Vera=Param("Vertical Positiona",17,1,830,1);
GfxTextOut(""+C, Hora , Vera );
YCa=TimeFrameGetPrice("C",inDaily,-1);
DDa=Prec(C-YCa,2);
xxa=Prec((DDa/YCa)*100,2);
FSb=Param("Font Sizeb",16,11,100,1);
GfxSelectFont("Times New Roman",fsb, 700, True );
GfxSetBkMode( colorBlack );
GfxSetTextColor(ParamColor("Color",colorYellow) );
GfxTextOut(""+DDa+"  ("+xxa+"%)", Hora , Vera+45 );
 _SECTION_END();
}}
//====================================Start of Linear Regression Code==================================================================================
if(LinearRegression==1)
{
P = ParamField("Price field",-1);

Length = 150;

Daysback = Param("Period for Liner Regression Line",Length,1,240,1);
shift = Param("Look back period",0,0,240,1);

//=============================== Math Formula ========================================================================================================

x = Cum(1);
lastx = LastValue( x ) - shift;
aa = LastValue( Ref(LinRegIntercept( p, Daysback), -shift) );
bb = LastValue( Ref(LinRegSlope( p, Daysback ), -shift) );
y = Aa + bb * ( x - (Lastx - DaysBack +1 ) );

//==================Plot the Linear Regression Line ====================================================================================================

LRColor = ParamColor("LR Color", colorCycle );
LRStyle = ParamStyle("LR Style");

LRLine =  IIf( x > (lastx - Daysback) AND BarIndex() < Lastx, y, Null );

LRStyle = ParamStyle("LR Style");
Angle = Param("Angle", 0.05, 0, 1.5, 0.01);// A slope higher than 0.05 radians will turn green, less than -0.05 will turn red and anything in between will be white.

LRLine = IIf( x > (lastx - Daysback) AND BarIndex() < Lastx, y, Null );

Pi = 3.14159265 * atan(1); // Pi
SlopeAngle = atan(bb)*(180/Pi);

LineUp = SlopeAngle > Angle;
LineDn = SlopeAngle < - Angle;

if(LineUp)
{
Plot(LRLine, "Lin. Reg. Line Up", IIf(LineUp, colorBrightGreen, colorWhite), LRStyle);
}
else
{
Plot(LRLine, "Lin. Reg. Line Down", IIf(LineDn, colorDarkRed, colorWhite), LRStyle);
}

//==========================  Plot 1st SD Channel ======================================================================================================

SDP = Param("Standard Deviation", 1.5, 0, 6, 0.1);
SD = SDP/2;

width = LastValue( Ref(SD*StDev(p, Daysback),-shift) ); //Set width of inside chanels here.
SDU = IIf( x > (lastx - Daysback) AND BarIndex() < Lastx, y+width , Null ) ;
SDL = IIf( x > (lastx - Daysback) AND BarIndex() < Lastx, y-width , Null ) ;

SDColor = ParamColor("SD Color", colorCycle );
SDStyle = ParamStyle("SD Style");

Plot( SDU , "Upper Lin Reg", colorWhite,SDStyle ); //Inside Regression Lines
Plot( SDL , "Lower Lin Reg", colorWhite,SDStyle ); //Inside Regression Lines

//==========================  Plot 2d SD Channel ========================================================================================================

SDP2 = Param("2d Standard Deviation", 2.0, 0, 6, 0.1);
SD2 = SDP2/2;

width2 = LastValue( Ref(SD2*StDev(p, Daysback),-shift) ); //Set width of outside chanels here.
SDU2 = IIf( x > (lastx - Daysback) AND BarIndex() < Lastx, y+width2 , Null ) ;
SDL2 = IIf( x > (lastx - Daysback) AND BarIndex() < Lastx, y-width2 , Null ) ;

SDColor2 = ParamColor("2 SD Color", colorCycle );
SDStyle2 = ParamStyle("2 SD Style");

Plot( SDU2 , "Upper Lin Reg", colorWhite,SDStyle2 ); //OutSide Regression Lines
Plot( SDL2 , "Lower Lin Reg", colorWhite,SDStyle2 ); //OutSide Regression Lines

Trend = IIf(LRLine > Ref(LRLine,-1),colorGreen,colorRed);//Changes LR line to green if sloping up and red if sloping down.

Plot( LRLine , "LinReg", Trend, LRSTYLE );

//============================ End Indicator Code =========
}

_SECTION_BEGIN("Flower");
Show_color = ParamToggle("Display CandleColor", "No|Yes", 1);
r1 = Param( "ColorFast avg", 5, 2, 200, 1 );
r2 = Param( "ColorSlow avg", 10, 2, 200, 1 );
r3 = Param( "ColorSignal avg", 5, 2, 200, 1 );

Prd1=Param("ATR Period",4,1,20,1);
Prd2=Param("Look Back",7,1,20,1);
green = HHV(LLV(L,Prd1)+ATR(Prd1),Prd2);
red = LLV(HHV(H,Prd1)-ATR(Prd1),Prd2);
flowerClose = EMA((Open+High+Low+Close)/4,3) ;
flowerOpen = EMA((Ref(Open,-1) + Ref(flowerClose,-1))/2,3);
Temp = Max(High, flowerOpen);
flowerHigh = EMA(Max(Temp, flowerClose),3);
Temp = Min(Low,flowerOpen);
flowerLow = EMA(Min(Temp, flowerClose),3);


m1=MACD(r1,r2);
s1=Signal(r1,r2,r3);
mycolor=IIf(m1<0 AND m1>s1, colorYellow,IIf(m1>0 AND m1>s1,colorGreen,IIf(m1>0 AND m1<s1,colorCustom12,colorRed)));
if(Show_color)
{
ColorHighliter = myColor;
SetBarFillColor( ColorHighliter );


}

barColor=IIf(C>Green ,colorBrightGreen,IIf(C < RED,colorRed,colorWhite));


PlotOHLC( IIf(flowerOpen<flowerClose, flowerOpen, flowerClose),flowerHigh,flowerLow,IIf(flowerOpen<flowerClose, flowerClose, flowerOpen), "Close", barColor, styleNoTitle | styleCandle);


_SECTION_END();


//**********************************************************************************
//        Plot price horizontal line                                               *
//**********************************************************************************/
_SECTION_BEGIN("Price Line");

PriceLineColor=ParamColor("PriceLineColor",ColorRGB(82,82,82));
PriceLevel = ParamField("PriceField", field = 3 );

Daysback    = Param("Bars Back",100,10,500,1);
FirstBar    = BarCount - DaysBack;
YY          = IIf(BarIndex() >= Firstbar,EndValue(PriceLevel),Null);

Plot(YY,"Current Price",PriceLineColor,ParamStyle("LineStyle",styleLine|styleDashed|styleNoTitle|styleNoLabel|styleThick,maskAll));


side = Param("side",1,0,1000,1);

dist = 0;

for( i = 0; i < BarCount; i++ )
{
 if(i+side== BarCount) PlotText( "\n    " + PriceLevel[ i ], i, YY[ i ]-dist[i], colorLightBlue );
}


_SECTION_END();


_SECTION_BEGIN("Color_Me_Bad");
a =5; //Param("Average Pds", 5, 1, 10, 1 );
n =8; //Param("Short Pds", 8, 5, 21, 1 );
m =60; //Param("Long Pds", 60, 0, 90, 1 );

Var4 =(Low+High+2*Close)/4;
OP = EMA(Var4,a);
res1 = HHV(OP,n);

res2 =HHV(OP,m);
sup2 =LLV(OP,m);
sup1 =LLV(OP,n);


Linecolor1 = IIf(Op==sup1,ColorRGB(48,0,81),IIf(Op==res1,colorGreen,ColorRGB(80,80,80)));
Linecolor2 = IIf(Op==sup1,ColorRGB(38,0,60),IIf(Op==res1,colorGreen,colorDarkGrey));
Linecolor3 = IIf(Op==sup1,ColorRGB(27,0,70),IIf(Op==res1,colorGreen,ColorRGB(77,70,75)));
_SECTION_END();

_SECTION_BEGIN("ATR");
ParmCloud1 = ParamToggle("TrailingCloud", "No|Yes", 1);
Pp1=Param("Ray_Period1",2,1,20,1); // or 4
Pp2=Param("ATR_Period1",3,1,20,1); // or 2

avgClose = EMA((Open+High+Low+Close)/4,3) ;
avgOpen = EMA((Ref(Open,-1) + Ref(avgClose,-1))/2,3);
Temp = Max(High, avgOpen);
avgHigh = EMA(Max(Temp, avgClose),3);
Temp = Min(Low,avgOpen);
avgLow = EMA(Min(Temp, avgClose),3);
Plot(HHV(LLV(avgHigh,Pp1)-ATR(Pp2),4),"",Linecolor1 ,ParamStyle("styleLine 1",styleLine|styleThick|styleNoTitle|styleNoLabel,maskAll));
Plot(HHV(LLV(avgHigh,Pp1)-ATR(Pp2),5),"",Linecolor2 ,ParamStyle("styleLine 2",styleLine|styleThick|styleNoTitle|styleNoLabel,maskAll));
Plot(HHV(LLV(avgHigh,Pp1)-ATR(Pp2),6),"",Linecolor1 ,ParamStyle("styleLine 3",styleLine|styleThick|styleNoTitle|styleNoLabel,maskAll));
Plot(HHV(LLV(avgHigh,Pp1)-ATR(Pp2),7),"",Linecolor1 ,ParamStyle("styleLine 4",styleLine|styleThick|styleNoTitle|styleNoLabel,maskAll));


CS33=HHV(LLV(avgHigh,Pp1)-ATR(Pp2),4);
CR33=HHV(LLV(avgHigh,Pp1)-ATR(Pp2),5);
CT33=HHV(LLV(avgHigh,Pp1)-ATR(Pp2),6);
CM33=HHV(LLV(avgHigh,Pp1)-ATR(Pp2),7);

if(parmCloud1 == 1)
{
PlotOHLC( CS33, CS33, CR33,CR33, "Band1", LineColor1, styleCloud | styleNoLabel|styleNoTitle);
PlotOHLC( CR33, CR33, CT33, CT33, "Band2", LineColor2, styleCloud | styleNoLabel|styleNoTitle);
PlotOHLC( CR33, CR33, CM33, CM33, "Band3", LineColor3, styleCloud | styleNoLabel|styleNoTitle);

}


_SECTION_END();

_SECTION_BEGIN("Bands");

SupResB =Param("Sup-Res Short",6,0,100,1);
nn=SupResB;


Bandlinecol=ParamColor("SupResLineColor",ColorRGB(82,82,82));
ParmCloud = ParamToggle("Cloud", "No|Yes", 0);
BoxCloudColor=ParamColor("BoxCloudColor",ColorRGB(27,27,27));


Line2=Param("ResLineLength",100,2,500,0.1);
Daysback1    = Line2;
FirstBar1    = BarCount - DaysBack1;
Hh=HHV(flowerHigh,nn);
LL=LLV(flowerLow,nn);

Res2=Hh;
Sup2=LL;

BandRes=IIf(BarIndex() >= Firstbar1,EndValue(Res2),Null);
BandSup=IIf(BarIndex() >= Firstbar1,EndValue(Sup2),Null);
Plot(BandRes,"",Bandlinecol,ParamStyle("ShortSupBand",styleLine|styleDashed|stylehidden|styleNoTitle|styleNoLabel|styleThick,maskAll));
Plot(BandSup,"",Bandlinecol,ParamStyle("ShortResBand",styleLine|styleDashed|stylehidden|styleNoTitle|styleNoLabel|styleThick,maskAll));


CS=BandRes;
CR=BandSup;


if(parmCloud == 1)
{
	PlotOHLC( CS, CS, CR,CR, "Band",BoxCloudColor, styleCloud | styleNoLabel|styleNoTitle);
}

_SECTION_END();


_SECTION_BEGIN("TSKPPIVOT4");
CHiPr = 0;
CLoPr = 9999999;
blsLong = 0;
PrevCOBar = 0;
NumBars = 0;
PrePP = 0;
PrevLowVal = 9999999;
BuySig = 0;
blsShort = 0;
PrevHiVal = 0;
blsNewCO = 0;
BarDif   = 0;

KPA900Val = MA(C,10);
KPAutoStopVal = IIf(High,Low,Close);

// -- Create 0-initialized arrays the size of barcount
aHPivs = H - H;
aLPivs = L - L;
aHiVal = H - H;
aLoVal = L - L;

Ctmpl=Param("Ctmpl",45,1,20,1);
tskp_colortmplcnd0=colorTan;
tskp_colortmplcnd1=colorWhite;
tskp_colortmplcnd2=colorTan;
tskp_colortmplcnd3=colorWhite;
tskp_colortmplcnd4=colorTan;
tskp_colortmplcnd5=colorWhite;
tskp_colortmplcnd6=colorTan;
tskp_colortmplcnd7=colorWhite;
tskp_colortmplcnd8=colorTan;
sctotal = 0;
sctotal = sctotal  + IIf(tskp_colortmplcnd0 > 0, 1, -1);
sctotal = sctotal  + IIf(tskp_colortmplcnd1 > 0, 1, -1);
sctotal = sctotal  + IIf(tskp_colortmplcnd2 > 0, 1, -1);
sctotal = sctotal  + IIf(tskp_colortmplcnd3 > 0, 1, -1);
sctotal = sctotal  + IIf(tskp_colortmplcnd4 > 0, 1, -1);
sctotal = sctotal  + IIf(tskp_colortmplcnd5 > 0, 1, -1);
sctotal = sctotal  + IIf(tskp_colortmplcnd6 > 0, 1, -1);
sctotal = sctotal  + IIf(tskp_colortmplcnd7 > 0, 1, -1);
sctotal = sctotal  + IIf(tskp_colortmplcnd8 > 0, 1, -1);


for (curBar=0; curBar < BarCount-1; curBar++)
{

	if ( curBar == 0 )
	{
		CHiPr = flowerHigh[curBar];
		CHiBar = curBar;
		CLoPr = flowerLow[curBar];
		CLoBar = curBar;
		blsLong = 0;
		blsShort = 0;
		blsNewCO = 0;
		PrePP = 0;
		PrevCOBar = 0;
		PrevHiVal =flowerHigh[curBar];
		PrevLowVal = flowerLow[curBar];
		BuySig = 0;
		SellSig = 0;
		blsLL  = 0;
	}

	if (flowerHigh[CurBar] >= CHiPr) {
		CHiPr = flowerHigh[CurBar];
		ChiBar = CurBar;
	}

	if (flowerLow[CurBar] <= CLoPr) {
		CLoPr = flowerLow[CurBar];
		CLoBar = CurBar;
	}

	if ( (KPA900Val[curBar] >= KPAutoStopVal[curbar]) AND (PrePP != -1) AND (blsLong != 1) ){
		BarDif = CurBar - PrevCOBar;
		if (BarDif >= NumBars) {
			blsLong = 1;
			blsShort = 0;
			blsNewCO = 1;
			PrevCOBar = CurBar;
		}
	}

	if ( (KPA900Val[curBar] <= KPAutoStopVal[curbar]) AND (PrePP != 1) AND (blsShort != 1) ){
		BarDif = CurBar - PrevCOBar;
		if (BarDif >= NumBars) {
			blsLong = 0;
			blsShort = 1;
			blsNewCO = 1;
			PrevCOBar = CurBar;
		}
	}

	if ( (blsNewCO == 1) AND (sctotal[CurBar] >= 5) AND (blsLong == 1) ) {
		LVal = CurBar - CLoBar;
		for (j= CLoBar-1; j <= CLoBar+1; j++)
		{
			if (j >=0) {
				aLPivs[j] = 1;
				aLoVal[j] = CLoPr;
			}
		}
		PrePP = -1;
		blsNewCO = 0;
		CHiPr = flowerHigh[CurBar];
		CHiBar = CurBar;
		CLoPr = flowerLow[Curbar];
		CLoBar = CurBar;
		}
		else if ((blsNewCO == 1) AND (sctotal[CurBar] <= -5) AND (blsShort == 1) ) {
		HVal = CurBar - CHiBar;
		for (j= CHiBar-1; j <= CHiBar+1; j++)
		{
			if (j >=0) {
				aHPivs[j] = 1;
				aHiVal[j] = CHiPr;
			}
		}
		PrePP = 1;
		blsNewCO = 0;
		CHiPr = flowerHigh[CurBar];
		CHiBar = CurBar;
		CLoPr = flowerLow[Curbar];
		CLoBar = CurBar;
		}
}

PlotShapes(
IIf(aHPivs == 1,shapeHollowSmallCircle,shapeNone),colorYellow ,0, aHiVal+0.05, offset = 5);

PlotShapes(
IIf(aLPivs == 1,shapeHollowSmallCircle,shapeNone), colorPink,0, aLoVal-0.05, Offset = -5);
_SECTION_END();


_SECTION_BEGIN("SupRes_Short");
supresshortcolor=ParamColor("SupResShort",ColorRGB(82,82,82));

//this is for short term support line
TimeFrameSet(inWeekly);
ShortSupLenght=Param( "ShortResistLength", 4, 1, 55 ,1);
ShortSupCond1=HHV(High,ShortSupLenght);
ShortSupCond2=Close<Ref(LLV(Low,4),-1);
ShortSupA=IIf(L>Ref(ShortSupCond2,-1),1,IIf(H<Ref(ShortSupCond1,-1),-1,0));
ShortSupB=ValueWhen(ShortSupA!=0,ShortSupA,1);
ShortSupResult=IIf(ShortSupB==1,ShortSupCond1,ShortSupCond2);
TimeFrameRestore();
FinalShortSup=TimeFrameExpand(ShortSupResult,inWeekly,expandFirst);

Plot(FinalShortSup ,"ShortResistance",supresshortcolor,styleLine|styleStaircase|styleThick|styleNoRescale|styleNoLabel|styleNoTitle);


//this is for short term resistance line
TimeFrameSet(inWeekly);
ShortResLenght=Param( "ShortSupportLenght", 4, 1, 55 ,1);
ShortResCond1=Close>Ref(HHV(High,4),-1);
ShortResCond2=LLV(Low,ShortResLenght);
ShortResA=IIf(H>Ref(ShortResCond1,-1),1,IIf(L<Ref(ShortResCond2,-1),-1,0));
ShortResB=ValueWhen(ShortResA!=0,ShortResA,1);
ShortResResult=IIf(ShortResB==1,ShortResCond2,ShortResCond1);
TimeFrameRestore();
FinalShortRes=TimeFrameExpand(ShortResResult,inWeekly,expandFirst);
Plot(FinalShortRes ,"ShortSupport",supresshortcolor,styleLine|styleThick|styleStaircase|styleNoRescale|styleNoLabel|styleNoTitle);

CS=FinalShortSup;
CR=FinalShortRes;

Step = (CR-CS)/4;
KC = CS + Step;
KB = KC + Step;
KA = KB + Step;

CloudColor1 = ParamColor("CloudColor1",ColorRGB(128,31,17));
CloudColor2 = ParamColor("CloudColor2",ColorRGB(139,139,0));
CloudColor3 = ParamColor("CloudColor3",ColorRGB(1,70,1));
CloudColor4 = ParamColor("CloudColor4",ColorRGB(41,105,05));

PlotOHLC( CS, CS, KC,KC, "Band", CloudColor1, styleCloud | styleNoLabel|styleNoTitle|styleNoRescale);
PlotOHLC( KC, KC, KB,KB, "Band", CloudColor2, styleCloud | styleNoLabel|styleNoTitle|styleNoRescale);
PlotOHLC( KB, KB, KA,KA, "Band", CloudColor3, styleCloud | styleNoLabel|styleNoTitle|styleNoRescale);
PlotOHLC( KA, KA, CR,CR, "Band", CloudColor4, styleCloud | styleNoLabel|styleNoTitle|styleNoRescale);


_SECTION_END();


_SECTION_BEGIN("SupRes_Long");

supreslongcolor=ParamColor("SupReslong",ColorRGB(0,0,234));


//this is for long term resistance line
TimeFrameSet(inWeekly);
LongResLength=Param( "ResistanceLength", 30, 1, 55 ,1);
LongResCond1=HHV(H,LongResLength);
LongResCond2=Close<Ref(LLV(Low,4),-1);
LongResA=IIf(L>Ref(LongResCond2,-1),1,IIf(H<Ref(LongResCond1,-1),-1,0));
LongResB=ValueWhen(LongResA!=0,LongResA,1);
LongResResult=IIf(LongResB==1,LongResCond1,LongResCond2);
TimeFrameRestore();
FinalResResult=TimeFrameExpand(LongResResult,inWeekly,expandFirst);

Plot(FinalResResult ,"Resistance",supreslongcolor,styleLine|styleThick|styleNoRescale|styleNoLabel|styleNoTitle);


//this is for long term support line
TimeFrameSet(inWeekly);
LongSupLenght=Param( "SupportLenght", 30, 1, 55 ,1);
LongSupCond1=Close>Ref(HHV(High,4),-1);
LongSupCond2=LLV(Low,LongSupLenght);
LongSupA=IIf(H>Ref(LongSupCond1,-1),1,IIf(L<Ref(LongSupCond2,-1),-1,0));
LongSupB=ValueWhen(LongSupA!=0,LongSupA,1);
LongSupResult=IIf(LongSupB==1,LongSupCond2,LongSupCond1);
TimeFrameRestore();
FinalSupResult=TimeFrameExpand(LongSupResult,inWeekly,expandFirst);
Plot(FinalSupResult ,"Support",supreslongcolor,styleLine|styleThick|styleNoRescale|styleNoLabel|styleNoTitle);


CloudResColor=ParamColor("LongColor",ColorRGB(0,0,45));


CS1=FinalResResult;
CR1=FinalSupResult;

	PlotOHLC( CS1, CS1, CR1,CR1, "", CloudResColor, styleCloud |styleStaircase|styleNoRescale| styleNoLabel|styleNoTitle);


_SECTION_END();

_SECTION_BEGIN("PanDora");
///////////////////////////////////
Title =
EncodeColor(colorWhite)+  Title = Name () + " | "
+EncodeColor(colorYellow) + Date() + " | "

+EncodeColor(colorTurquoise)+ "Open : "+ EncodeColor(colorLightGrey)+ O + " | "
+EncodeColor(colorTurquoise)+ "High : "+ EncodeColor(colorLightGrey)+ H + " | "
+EncodeColor(colorTurquoise)+ "Low : "+ EncodeColor(colorLightGrey)+ L + " | "
+EncodeColor(colorTurquoise)+ "Close : "+ WriteIf(C> Ref(C, -1),EncodeColor(colorBrightGreen),EncodeColor(colorRed))+ C + " | "
+EncodeColor(colorTurquoise)+ "Change : ("+ WriteIf(C> Ref(C, -1),EncodeColor(colorBrightGreen),EncodeColor(colorRed)) + WriteVal(C-Ref(C,-1))+" Tk."
+EncodeColor(colorTurquoise)+ " /"+ WriteIf(C> Ref(C, -1),EncodeColor(colorBrightGreen),EncodeColor(colorRed))+ WriteVal( ROC( C, 1 ))+""+ " % "
+EncodeColor(colorTurquoise)+ ") | Volume : " + WriteIf(V> Ref(V, -1),EncodeColor(colorBrightGreen),EncodeColor(colorRed))+ WriteVal(V,1)
;

/////////////////////////////////////////////////////////
//																//
//			General Market Exploration by XeL				//
//																//
//						Ver: 1.00.beta						//
//																//
//	Free to Distribute under LGPL 2012	.					//
//	Portions of Code are property of their original		//
//	authors, Cleaning, some new code and Preparation	//
//	are derived by @XeL_Arjona.								//
//	Some Original Code credits:								//
//																//
//	*	Volume Price Analysis by Karthikmarar				//
//			http://vpanalysis.blogspot.mx/					//
//																//
//	*	Jurik Research DMX (Free)							//
//			http://jurikres.com/catalog/ms_dmx.htm		//
//																//
//	*	Extract of some exploration Methodology			//
//		by Manish.												//
//																//
//																//
/////////////////////////////////////////////////////////


/////////////////
//  AFL START  //
/////////////////

//_SECTION_BEGIN("VPA, Momentum & Signal Explorer by XeL");


//////////////////////
// Main Variables   //
//////////////////////
// Count Index value for TrendScore
	i	=	0;
// Display Colors
// Main Color
	Color_buy		=	colorLime				;
	Color_bull		=	colorGreen				;
	Color_bull1	=	colorDarkYellow		;
	Color_bear1	=	colorLightOrange		;
	Color_bear		=	colorOrange			;
	Color_sell		=	colorRed				;
	Color_prev		=	colorGold				;
	Color_acc		=	colorPaleTurquoise	;
	Color_null		=	colorLightGrey		;
//	Background Colors
	BColor_vpa		=	colorBlack				;
	BColor_mas		=	colorDefault			;
	BColor_mam		=	colorDefault			;
	BColor_mal		=	colorDefault			;
//	Alternate Colors
	Color_acc1		=	colorBlueGrey			;

// 52 High Low
High52		=	HHV(High,250);
Low52		=	LLV(Low,250);
// T3 Function
function T3(price,periods)
	{
		s = 0.84;
		e1=EMA(price,periods);
		e2=EMA(e1,Periods);
		e3=EMA(e2,Periods);
		e4=EMA(e3,Periods);
		e5=EMA(e4,Periods);
		e6=EMA(e5,Periods);
		c1=-s*s*s;
		c2=3*s*s+3*s*s*s;
		c3=-6*s*s-3*s-3*s*s*s;
		c4=1+3*s+s*s*s+3*s*s;
		Ti3=c1*e6+c2*e5+c3*e4+c4*e3;
		return ti3;
	}


////////////////////////////////////////////////
// Time to Date % Change and Beta Correlation //
////////////////////////////////////////////////
_SECTION_BEGIN("P/L % Change over Time with Beta Correlation");
// PARAMETERS
	TtD_Param		=	ParamList("Period","Day to Date|Week to Date|Month to Date|Year to Date",0);
	IDX_Param		=	ParamStr("Reference Market Index Symbol","$IME-MEX");
// VARIABLES
	FDayMonth		=	BarsSince(Month() != Ref(Month(),-1));
	FDayYear		=	BarsSince(Year() != Ref(Year(),-1));
	TtD_Period		=	IIf(TtD_Param	==	"Day to Date",1,
						IIf(TtD_Param	==	"Week to Date",DayOfWeek(),
						IIf(TtD_Param	==	"Month to Date",FDayMonth,
						IIf(TtD_Param	==	"Year to Date",FDayYear,0))));
	IDX_Close		=	Foreign(IDX_Param,"Close");
// FORMULA
//		P/L % Change
	TtD_Change		= 100 * (Close - Ref(Close, -TtD_Period) ) / Ref(Close, -TtD_Period);
//		Beta Correlation in Time from Index
	Beta			=	(( TtD_Period * Sum(ROC( C,1) * ROC(IDX_Close,1),TtD_Period )) -
						(Sum(ROC(C,1),TtD_Period) *
						Sum(ROC( IDX_Close,1),TtD_Period))) /
						((TtD_Period * Sum((ROC(IDX_Close,1)^2 ),TtD_Period)) -
						(Sum(ROC(IDX_Close,1 ),TtD_Period)^2 ));
_SECTION_END();


///////////////////////////
// Volume Price Analysis //
///////////////////////////
_SECTION_BEGIN("Volume Price Analysis");
// FORMULA
	SetChartOptions(0,chartShowArrows|chartShowDates);
	DTL=Param("Linear regression period",60,10,100,10);
	wbf=Param("WRB factor",1.5,1.3,2.5,.1);
	nbf=Param("NRB factor",0.7,0.3,0.9,0.1);
	TL=LinRegSlope(MA(C, DTL),2);
	Vlp=Param("Volume lookback period",30,20,300,10);
	Vrg=MA(V,Vlp);
	St = StDev(Vrg,Vlp);
	Vp3 = Vrg + 3*st;
	Vp2 = Vrg + 2*st;;
	Vp1 = Vrg + 1*st;;
	Vn1 = Vrg -1*st;
	Vn2 = Vrg -2*st;
	rg=(H-L);
	arg=Wilders(rg,30);
	wrb=rg>(wbf*arg);
	nrb=rg<(nbf*arg);
	Vl=V<Ref(V,-1) AND V<Ref(V,-2);
	upbar=C>Ref(C,-1);
	dnbar=C<Ref(C,-1);
	Vh=V>Ref(V,-1) AND Ref(V,-1)>Ref(V,-2);
	Cloc=C-L;
	x=rg/Cloc;
	x1=IIf(Cloc=0,arg,x);
	Vb=V>Vrg OR V>Ref(V,-1);
	ucls=x1<2;
	dcls=x1>2;
	mcls=x1<2.2 AND x1>1.8 ;
	Vlcls=x1>4;
	Vhcls=x1<1.35;
	j=MA(C,5);
	TLL=LinRegSlope(j,40) ;
	Tlm=LinRegSlope(j,15) ;
	tls=LinRegSlope(j,5);
	mp=(H+L)/2;
// VOLUME VARIABLES
//		TrendScore Count
	IIf( V>Vp2, i+3,i);
	IIf( V>Vp1, i+2,i);
	IIf( V>VRG, i+1,i);
//		Indicators
	VPAv_Status	=	WriteIf( V>Vp2,	"VERY HIGH",
						WriteIf( V>Vp1,	"High",
						WriteIf( V>Vrg,	"Above Average",
						WriteIf( V<Vrg AND V>Vn1, "Less than Average",
						WriteIf( V<Vn1, "L o w", "" )))));
	VPAv_Color	=		IIf( V>Vp2, Color_buy,
						IIf( V>Vp1, Color_bull,
						IIf( V>Vrg, Color_bull1,
						IIf( V<Vrg AND V>Vn1, Color_bear,
						IIf( V<Vn1, Color_sell, Color_null )))));

// SPREAD VARIABLES
//		Indicators
	IIf( rg>(arg*2), i+2,i);
	IIf( rg>arg, i+1,i);
	VPAs_Status	=	WriteIf( rg>(arg*2), "Wide",
						WriteIf( rg>arg, "Above Average","Narrow"));
	VPAs_Color		=	IIf( rg>(arg*2), Color_buy,
						IIf( rg>arg, Color_bull,Color_bear));

// CLOSE VARIABLES
//		TrendScroe Count
	IIf( Vhcls, i+2,i);
	IIf( ucls, i+1,1);
//		Indicators
	VPAc_Status	=	WriteIf( Vhcls, "VERY HIGH",
						WriteIf( ucls, "High",
						WriteIf( mcls, "Mid",
						WriteIf( dcls, "Down","VERY LOW"))));
	VPAc_Color		=	IIf( Vhcls, Color_buy,
						IIf( ucls, Color_bull,
						IIf( mcls, Color_bull1,
						IIf( dcls, Color_bear,Color_sell))));

// VOLUME ZONE
// FORMULA
	C1 = Ref(C, -1);
	uc = C > C1; dc = C <= C1;
	ud = C > O; dd = C <= O;
	green = 1; blue = 2; yellow = 3; red = 4; white = 5;
	VType = IIf(ud,
	         IIf(uc, green, yellow),
	       IIf(dd,
	         IIf(dc, red, blue), white));
	/* green volume: up-day and up-close*/
	gv = IIf(VType == green, V, 0);
	/* yellow volume: up-day but down-close */
	yv = IIf(VType == yellow, V, 0);
	/* red volume: down-day and down-close */
	rv = IIf(VType == red, V, 0);
	/* blue volume: down-day but up-close */
	bv = IIf(VType == blue, V, 0);
	uv = gv + bv; uv1 = Ref(uv, -1); /* up volume */
	dv = rv + yv; dv1 = Ref(dv, -1); /* down volume */
	VolPer = Param("Adjust Vol. MA per.", 34, 1, 255, 1);//12
	ConvPer = Param("Adjust Conv. MA per.", 9, 1, 255, 1);//6
	MAuv = TEMA(uv, VolPer ); mauv1 = Ref(mauv, -1);
	MAdv = TEMA(dv, VolPer ); madv1 = Ref(madv, -1);
	MAtv = TEMA(V, VolPer );//total volume
	Converge = (TEMA(MAuv - MAdv, ConvPer));
	Converge1 = Ref(Converge, -1);
	ConvergeUp = Converge > Converge1;
	ConvergeOver = Converge > 0;
	rising = ConvergeUp AND ConvergeOver;
	falling = !ConvergeUp AND ConvergeOver;
// VOLUME ZONE
// VARIABLES
//		TrendScore Count
	IIf( rising, i+1,i);
//		Indicators
	VPAz_Status	=	WriteIf(rising,"Accumulation",
						WriteIf(falling,"Distribution","Flat"));
	VPAz_Color		=	IIf(rising,Color_acc,
						IIf(falling,Color_prev,Color_null));

// VOLUME STATUS
// PARAMETERS
	Pp1=Param("Number Of Days",30,1,200,1);
	Pp2=Param("Volume Of Days",15,1,200,1);
// FORMULA
	numDays = Pp1;
	dwWideSpread = 1.8;
	dwNarrowSpread = 0.8;
	dwSpreadMiddle = 0.5;
	dwHighClose = 0.7;
	dwLowClose = 0.3;
	volNumDays = Pp2;
	dwUltraHighVol = 2;
	dwVeryHighVol = 1.75; // was 1.8
	dwHighVol = 1.75; // was 1.8
	dwmoderateVol = 1.10; // was 1.8
	dwLowVol = 0.75; // was 0.8
	/* Classify each bar... */
	upBar = C > Ref(C,-1);
	downBar = C < Ref(C,-1);
	spread = H-L;
	avgRange = Sum(spread, numDays) / numDays;
	wideRange = spread >= (dwWideSpread * avgRange);
	narrowRange = spread <= (dwNarrowSpread * avgRange);
	testHighClose = L + (spread * dwHighClose);
	testLowClose = L + (spread * dwLowClose);
	testCloseMiddle = L + (spread * dwSpreadMiddle);
	upClose = C > testHighClose;
	downClose = C < testLowClose;
	middleClose = C >= testLowClose AND C <= testHighClose;
	avgVolume = EMA(V, volNumDays);
	highVolume = V > (avgVolume * dwHighVol);
	moderateVol= V > (avgVolume * dwmoderateVol);
	veryHighVolume = V > (avgVolume * dwVeryHighVol);
	ultraHighVolume = V > (avgVolume * dwUltraHighVol);
	LowVolume = V < (avgVolume * dwLowVol);
	/* direction AND Title */
	/* Basic patterns... */
	upThrustBar = downClose AND H > Ref(H,-1) AND (C == L) AND downClose AND (NOT narrowRange);
	noDemandBar = narrowRange AND LowVolume AND upBar AND (NOT upClose);
	//noDemandBar = narrowRange AND LowVolume AND upBar AND (V < Ref(V,-1)) AND (V < Ref(V,-2));
	noSupplyBar = narrowRange AND LowVolume AND downBar AND (V < Ref(V,-1)) AND (V < Ref(V,-2));
	absorption = Ref(downbar, -1) AND Ref(highVolume, -1) AND upBar;
	support = Ref(downBar,-1) AND (NOT Ref(downClose,-1)) AND Ref(highVolume,-1) AND upBar;
	stoppingVolume = Ref(downBar,-1) AND Ref(highVolume,-1) AND C > testCloseMiddle AND (NOT downBar);
	bullishsign=moderateVol+UpThrustBar;//OR moderateVol+upBar;
	//rallyEnd = (Ref(highVolume,-1) AND Ref(upBar,-1) AND wideRange AND downBar) OR
	// (narrowRange AND highVolume AND H > Ref(HHV(H, 250), -1));
	/* Strength AND Weakness */
	weakness = upThrustBar OR noDemandBar OR
	(narrowRange AND (H > Ref(H,-1)) AND highVolume) OR
	(Ref(highVolume,-1) AND Ref(upBar,-1) AND downBar AND (H < Ref(H,-1)));
// VARIABLES
//		TrendScore Count
	IIf( bullishsign, i+3,i);
	IIf( upThrustBar, i+2,i);
	IIf( absorption, i+1,i);
//		Indicators
	VPAst_Status	=	WriteIf(Weakness,"W e a k",
						WriteIf(StoppingVolume,"Stopping Volume",
						WriteIf(noSupplyBar,"No Supply",
						WriteIf(support,"Support",
						WriteIf(noDemandBar,"No Demand",
						WriteIf(absorption,"Absorption",
						WriteIf(upThrustBar,"Up Thrust",
						WriteIf(bullishsign,"-=STRONG=-","Neutral"))))))));
	VPAst_Color	=	IIf(Weakness,Color_sell,
						IIf(StoppingVolume,Color_bear,
						IIf(noSupplyBar,Color_bear1,
						IIf(support,Color_bear,
						IIf(noDemandBar,Color_prev,
						IIf(absorption,Color_bull1,
						IIf(upThrustBar,Color_bull,
						IIf(bullishsign,Color_buy,Color_null))))))));
_SECTION_END();


//////////////////////////
// EMA Terms and Trend  //
//////////////////////////
_SECTION_BEGIN("EMA Short, Mid and Long Terms and Trend");
// PARAMETERS
	EMAs1Pds	=	Param("1st. Short Term Period",9,5,14,1);
	EMAs2Pds	=	Param("2nd. Short Term Period",20,15,45,1);
	EMAmPds	=	Param("Mid Term Period",50,46,90,1);
	EMAlPds	=	Param("Long Term Perdiod",200,100,300,1);
// FORMULA
//	EMA Short term signals
	EMAsBuy	=	Cross(EMA(C,EMAs1Pds), EMA(C,EMAs2Pds));
	EMAsSell	=	Cross(EMA(C,EMAs2Pds),EMA(C,EMAs1Pds));
	EMAsBuy	=	ExRem(EMAsBuy, EMAsSell);
	EMAsSell	=	ExRem(EMAsSell, EMAsBuy);
	EMAsBull	=	EMA(C,EMAs1Pds) > EMA(C,EMAs2Pds);
	EMAsBear	=	EMA(C,EMAs1Pds) < EMA(C,EMAs2Pds);
//	EMA Mid term signals
	EMAmBuy	=	Cross(EMA(C,(EMAs1Pds+EMAs2Pds)/2), EMA(C,EMAmPds));
	EMAmSell	=	Cross(EMA(C,EMAmPds), EMA(C,(EMAs1Pds+EMAs2Pds)/2));
	EMAmBuy	=	ExRem(EMAmBuy, EMAmSell);
	EMAmSell	=	ExRem(EMAmSell, EMAmBuy);
	EMAmBull	=	C > EMA(C,EMAmPds);
	EMAmBear	=	C < EMA(C,EMAmPds);
//	EMA Long term signals
	EMAlBuy	=	Cross(EMA(C,EMAmPds), EMA(C,EMAlPds));
	EMAlSell	=	Cross(EMA(C,EMAlPds), EMA(C,EMAmPds));
	EMAlBuy	=	ExRem(EMAlBuy, EMAlSell);
	EMAlSell	=	ExRem(EMAlSell, EMAlBuy);
	EMAlBull	=	C > EMA(C,EMAlPds);
	EMAlBear	=	C < EMA(C,EMAlPds);
// EMA Positional Price Trend (Long-Term)
	EMA_rc		=	C > EMA (C,EMAmPds) AND C < EMA(C,EMAlPds) AND EMA(C,EMAmPds) < EMA(C,EMAlPds);
	EMA_ac		=	C > EMA (C,EMAmPds) AND C > EMA(C,EMAlPds) AND EMA(C,EMAmPds) < EMA(C,EMAlPds);
	EMA_bl		=	C > EMA (C,EMAmPds) AND C > EMA(C,EMAlPds) AND EMA(C,EMAmPds) > EMA(C,EMAlPds);
	EMA_pr		=	C < EMA (C,EMAmPds) AND C > EMA(C,EMAlPds) AND EMA(C,EMAmPds) > EMA(C,EMAlPds);
	EMA_ds		=	C < EMA (C,EMAmPds) AND C < EMA(C,EMAlPds) AND EMA(C,EMAmPds) > EMA(C,EMAlPds);
	EMA_br		=	C < EMA (C,EMAmPds) AND C < EMA(C,EMAlPds) AND EMA(C,EMAmPds) < EMA(C,EMAlPds);
// VARIABLES
//		TrendScore Count
	IIf(EMAsBuy,i+1,i);
	IIf(EMAmBuy,i+1,i);
	IIf(EMAlBuy,i+1,i);
	IIf(EMA_rc,i+3,i);
	IIf(EMA_ac,i+2,i);
	IIf(EMA_bl,i+1,1);
	EMAs_Status	=	WriteIf(EMAsBuy, "-=BUY=-",
						WriteIf(EMAsSell, "-=SELL=-",
						WriteIf(EMAsBull, "Bullish",
						WriteIf(EMAsBear, "Bearish","Neutral"))));
	EMAs_Color		=	IIf(EMAsBuy, Color_buy,
						IIf(EMAsBull, Color_bull,
						IIf(EMAsBear, Color_bear,
						IIf(EMAsSell, Color_sell,Color_null))));
	EMAm_Status	=	WriteIf(EMAmBuy, "-=BUY=-",
						WriteIf(EMAmSell, "-=SELL=-",
						WriteIf(EMAmBull, "Bullish",
						WriteIf(EMAmBear, "Bearish","Neutral"))));
	EMAm_Color		=	IIf(EMAmBuy, Color_buy,
						IIf(EMAmBull, Color_bull,
						IIf(EMAmBear, Color_bear,
						IIf(EMAmSell, Color_sell,Color_null))));
	EMAl_Status	=	WriteIf(EMAlBuy, "-=BUY=-",
						WriteIf(EMAlSell, "-=SELL=-",
						WriteIf(EMAlBull, "Bullish",
						WriteIf(EMAlBear, "Bearish","Neutral"))));
	EMAl_Color		=	IIf(EMAlBuy, Color_buy,
						IIf(EMAlBull, Color_bull,
						IIf(EMAlBear, Color_bear,
						IIf(EMAlSell, Color_sell,Color_null))));
	EMAp_Status	=	WriteIf(EMA_rc, "RECOVERY",
						WriteIf(EMA_ac, "Accumulation",
						WriteIf(EMA_bl, "Bullish",
						WriteIf(EMA_pr, "Preventive",
						WriteIf(EMA_ds, "Distribution",
						WriteIf(EMA_br, "Bearish","Neutral"))))));
	EMAp_Color		=	IIf(EMA_rc, Color_buy,
						IIf(EMA_ac, Color_acc1,
						IIf(EMA_bl, Color_bull,
						IIf(EMA_pr, Color_prev,
						IIf(EMA_ds, Color_bear1,
						IIf(EMA_br, Color_bear,Color_null))))));
_SECTION_END();


////////////////////////
// Initial Buy signal //
////////////////////////
_SECTION_BEGIN("IBuy Signal");
// FORMULA
	I_buy =  Cross(RSI(14), EMA(RSI(14),9));
	I_sell = Cross(EMA(RSI(14),9), RSI(14));
	I_buy = ExRem(I_buy, I_sell);
	I_sell = ExRem(I_sell, I_buy);
	I_bull = RSI(14) > EMA(RSI(14),9);
	I_bear = RSI(14) < EMA(RSI(14),9);
// VARIABLES
//		TrendScore Count
	IIf(I_buy,i+2,i);
	IIf(I_bull,i+1,i);
//		Indicators
	I_Status	=	WriteIf(I_buy,"-=BUY=-",
					WriteIf(I_bull,"Bullish",
					WriteIf(I_bear,"Bearish",
					WriteIf(I_sell,"-=SELL=-","Neutral"))));
	I_Color	=	IIf(I_buy,Color_buy,
					IIf(I_bull,Color_bull,
					IIf(I_bear,Color_bear,
					IIf(I_sell,Color_sell,Color_null))));
_SECTION_END();


/////////////////////
// Price Smoothing //
/////////////////////
_SECTION_BEGIN("T3 Price Smoothing Signal");
// FORMULA
	T3_buy		=	Cross (T3(C,3), T3(C,5));
	T3_sell	=	Cross (T3(C,5), T3(C,3));
	T3_buy		=	ExRem(T3_buy, T3_sell);
	T3_sell	=	ExRem(T3_sell, T3_buy);
// VARIABLES
//		TrendScore Count
	IIf(T3_buy,i+1,i);
//		Indicators
	T3_Status	=	WriteIf(T3_buy,"-=BUY=-",
					WriteIf(T3_sell,"-=SELL=-","Neutral"));
	T3_Color	=	IIf(T3_buy,Color_buy,
					IIf(T3_sell,Color_sell,Color_null));
_SECTION_END();


////////////////////
// Bollinger Band //
////////////////////
_SECTION_BEGIN("Bollinger Bands");
// FORMULA
	BB1			=	C>BBandTop(C,20,2) AND Ref(C,-1)<Ref(BBandTop(C,20,2),-1);
	BB2			=	C<BBandBot(C,20,2) AND Ref(C,-1)>Ref(BBandBot(C,20,2),-1);
// VARIABLES
//		TrendScore Count
	IIf(BB1,i+1,i);
//		Indicators
	BB_Status	=	WriteIf(BB1,"Above Top",
					WriteIf(BB2,"Below Bottom",
					WriteIf(IsNull(MA(C,20)),"N/A","Neutral")));
	BB_Color	=	IIf(BB1,Color_bull,
					IIf(BB2,Color_bear,Color_null));
_SECTION_END();


//////////
// MACD //
//////////
_SECTION_BEGIN("MACD Signal");
// FORMULA
	MACDBull		=	MACD(12,26)>Signal(12,26,9);
// VARIABLES
//		TrendScore Count
	IIf(MACDBull,i+1,i);
//		Indicators
	MACD_Status		=	WriteIf(MACDBull,"Bullish",
							WriteIf(IsNull(MACD(12,26)),"N/A","Bearish"));
	MACD_Color			=	IIf(MACDBull,Color_bull,
							IIf(IsNull(MACD(12,26)),Color_null,Color_bear));
_SECTION_END();


/////////////////
// RSI of MACD //
/////////////////
_SECTION_BEGIN("RSI of MACD Signal");
// PARAMETERS
	RSItPds=Param("Period",14,7,33,1);
	RSItOb_Parm=Param("OverBought Level",70,-200,200,5);
	RSItOs_Parm=Param("OverSold Level",30,-200,200,5);
// FORMULA
	Var=MACD();
	Up=IIf(Var>Ref(Var,-1),abs(Var-Ref(Var,-1)),0);
	Dn=IIf(Var<Ref(Var,-1),abs(Var-Ref(Var,-1)),0);
	Ut=Wilders(Up,RSItPds);
	Dt=Wilders(Dn,RSItPds);
	RSIt=100*(Ut/(Ut+Dt));
	//RSItBuy	=	RSIt < RSItOs_Parm AND RSIt > Ref(RSIt,-1);
	//RSItOs		=	RSIt < RSItOs_Parm AND RSIt < Ref(RSIt,-1);
	//RSItNu		=	RSIt < RSItOs_Parm AND RSIt > RSItOb_Parm AND RSIt > Ref(RSIt,-1);
	//RSItNd		=	RSIt < RSItOs_Parm AND RSIt > RSItOb_Parm AND RSIt < Ref(RSIt,-1);
	//RSItOb		=	RSIt <	RSItOb_Parm AND RSIt > Ref(RSIt,-1);
	//RSItSell		=	RSIt <	RSItOb_Parm AND RSIt < Ref(RSIt,-1);
	RSItOs			=	RSIt < RSItOs_Parm;
	RSItOb			=	RSIt > RSItOb_Parm;
	// VARIABLES
	//		TrendScore Count
	IIf(RSItOs, i+1,i);
	//		Indicators
	RSIt_Status	=	WriteIf(RSItOs,"OverSold",
						WriteIf(RSItOb,"OverBought","In Range"));
	RSIt_Color	=		IIf(RSItOs,Color_bull,
						IIf(RSItOb,Color_sell,Color_null));
_SECTION_END();


///////////
// Aroon //
///////////
//_SECTION_BEGIN("AROON Signal");
//// PARAMETERS
//	ArPeriod=Param("Period",14,7,33,1);
//// FORMULA
//	LLVBarsSince=LLVBars(L,ArPeriod)+1;
//	HHVBarsSince=HHVBars(H,ArPeriod)+1;
//	AroonDown=100*(ArPeriod-LLVBarsSince)/(ArPeriod-1);
//	AroonUp=100*(ArPeriod-HHVBarsSince)/(ArPeriod-1);
//	AroonOsc=AroonUp-AroonDown;
//	Aroon=AroonOsc>0;
//// VARIABLES
//	IIf(Aroon,i+1,i);
//	AROON_Status	=	WriteIf(Aroon,"Bullish",
//						WriteIf(IsNull (RSI(14)),"N/A","Bearish"));
//	AROON_Color	=	IIf(Aroon,Color_bull,
//						IIf(IsNull(RSI(14) ),Color_null,Color_bear));
//_SECTION_END();


/////////
// WAD //
/////////
//_SECTION_BEGIN("Williams Accumulation-Distribution Signal");
// PARAMETERS
//	WADPds=Param("Period",20,7,33,1);
	// FORMULA
//	TrueRangeHigh=Max( Ref(Close,-1), High );
//	TrueRangeLow=Min( Ref(Close,-1), Low );
//	WAD = Cum(IIf(C > Ref(C,-1),C-TrueRangeLow, IIf(C < Ref(C,-1),C-TrueRangeHigh,0)));
//	wadup = WAD > EMA (WAD,WADPds);
//	waddn = WAD < EMA (WAD,WADPds);
//	wadbl = Cross(WAD, EMA(WAD,WADPds));
//	wadbr = Cross(EMA(WAD,WADPds), WAD);
// VARIABLES
//	WAD_Status	=	WriteIf(wadup, "Bullish Zone",
//					WriteIf(waddn, "Bearish Zone",
//					WriteIf(wadbl, "Bullish Cross",
//					WriteIf(wadbr, "Bearish Cross","Neutral"))));
//	WAD_Color	=	IIf(wadup,Color_bull,
//					IIf(wadbl,Color_bear,
//					IIf(wadbr,Color_bull1,
//					IIf(waddn,Color_bear1,Color_null))));
//_SECTION_END();


/////////////
// Coppock //
/////////////
_SECTION_BEGIN("Coppock Indicator");
// FORMULA
	CKr1=ROC(C,14);
	CKr2=ROC(C,11);
	CK=EMA((CKr1+CKr2),10);
	CK_upt=IIf(ck>0 AND ROC(ck,1)>0,ck,0);
	CK_ups=IIf(ck>0 AND ROC(ck,1)<0,ck,0);
	CK_dws=IIf(ck<0 AND ROC(ck,1)>0,ck,0);
	CK_dwt=IIf(ck<0 AND ROC(ck,1)<0,ck,0);
// VARIABLES
//		TrendScore Count
	IIf(CK_upt,i+2,i);
	IIf(CK_ups,i+1,i);
//		Indicators
	Coppock_Status	=	WriteIf( CK_upt,"UPTREND",
							WriteIf( CK_ups,"UpT Sideways",
							WriteIf( CK_dws,"DnT Sideways",
							WriteIf( CK_dwt,"DownTrend","Flat"))));
	Coppock_Color		=	IIf( CK_upt,Color_buy,
							IIf( CK_ups,Color_bull,
							IIf( CK_dws,Color_bear,
							IIf( CK_dwt,Color_sell,Color_null))));
_SECTION_END();


////////////////
// Stochastic //
////////////////
_SECTION_BEGIN("Stochastic %D %K Signal");
// FORMULA
	StochKBull		=	StochK(14,3)>StochD(14,3,3);
// VARIABLES
//		TrendScore Count
	IIf(StochKBull,i+1,i);
//		Indicators
	STOCH_Status	=	WriteIf( StochKBull,"Bullish",
						WriteIf( IsNull(StochK(14,3)),"N/A","Bearish"));
	STOCH_Color	=	IIf(StochKBull,Color_bull,
						IIf( IsNull(StochK(14,3)),Color_null,Color_bear));
_SECTION_END();


//////////
// ARSI //
//////////
_SECTION_BEGIN("ARSI Signal");
// PARAMETERS
	ARSI_Pds		=	Param("Period",14,7,33,1);
	ARSIOb_Parm	=	Param("OverBought Level",70,-200,200,5);
	ARSIOs_Parm	=	Param("OverSold Level",30,-200,200,5);
// FORMULA
	Chg 			=	C - Ref( C, -1 );
	UpCount		=	Sum( Chg >= 0, ARSI_Pds );
	DnCount		=	ARSI_Pds - UpCount;
	UpMove			=	AMA( Max( Chg, 0 ), Nz(1/UpCount) );
	DnMove			=	AMA( Max( -Chg, 0 ), Nz(1/DnCount) );
	RS				=	UpMove/DnMove;
	ARSI			=	100-(100/(1+RS));
	ARSIOs			=	ARSI < ARSIOs_Parm;
	ARSIOb			=	ARSI > ARSIOb_Parm;
	//ARSIUt		=	ARSI > Ref(ARSI,-1);
	//ARSIDt		=	ARSI < Ref(ARSI,-1);
	//ARSIBuy		=	ARSI < ARSIOs AND ARSIUt;
	//ARSISell		=	ARSI >	ARSIOb AND ARSIDt;
	//ARSIBuy		=	ExRem(ARSIBuy, ARSISell);
	//ARSISell		=	ExRem(ARSISell,ARSIBuy);
// VARIABLES
//		TrendScroe Count
	IIf(ARSIOs,i+1,i);
//		Indicators
	ARSI_Status		=	WriteIf(ARSIOs,"OverSold",
							WriteIf(ARSIOb,"OverBought","In Range"));
							//WriteIf(ARSIBuy,"-=BUY=-",
							//WriteIf(ARSI>ARSIOs,"OverSold",
							//WriteIf(ARSIUt,"Improving",
							//WriteIf(ARSIDt,"Declining",
							//WriteIf(ARSI<ARSIOb,"OverBought",
							//WriteIf(ARSISell,"-=SELL=-",""))))));
	ARSI_Color		=		IIf(ARSIOs,Color_bull,
							IIf(ARSIOb,Color_sell,Color_null));
							//IIf(ARSIBuy,Color_buy,
							//IIf(ARSI>ARSIOs,Color_bull,
							//IIf(ARSIUt,Color_bull1,
							//IIf(ARSIDt,Color_bear1,
							//IIf(ARSI<ARSIOb,Color_bear,
							//IIf(ARSISell,Color_sell,Color_null))))));
_SECTION_END();


/////////
// RSI //
/////////
//_SECTION_BEGIN("RSI Signal");
// PARAMETERS
//	RSIPds=Param("Period",14,7,33,1);
//	RSIOb=Param("OverBought Level",70,-200,200,5);
//	RSIOs=Param("OverSold Level",30,-200,200,5);
// FORMULA
//	R1=RSI(RSIPds)>RSIOs AND Ref(RSI(RSIPds),-1)<RSIOs AND Ref(RSI(RSIPds),-2)<RSIOs;
//	R2=RSI(RSIPds)<RSIOb AND Ref(RSI(RSIPds),-1)>RSIOb AND Ref(RSI(RSIPds),-2)>RSIOb;
// VARIABLES
//	IIf(R1,i+1,i);
//	RSI_Status		=	WriteIf(R1,"Improving",
//						WriteIf(R2,"Declining",
//						WriteIf(IsNull(RSI(14)),"N/A","Neutral")));
//	RSI_Color		=	IIf(R1,Color_bull1,
//						IIf(R2,Color_bear1,Color_null));
//_SECTION_END();


/////////
// MFI //
/////////
_SECTION_BEGIN("MFI Signal");
// PARAMETERS
	MFIPds=Param("Period",14,7,33,1);
	MFIOb=Param("OverBought Level",80,-200,200,5);
	MFIOs=Param("OverSold Level",20,-200,200,5);
// FORMULA
	M1=MFI(MFIPds)>MFIOb;
	M2=MFI(MFIPds)<MFIOs;
//	VARIABLES
//		TrendScroe Count
	IIf(M2,i+1,i);
//		Indicators
	MFI_Status		=	WriteIf(M1,"OverBought",
						WriteIf(M2,"OverSold",
						WriteIf(IsNull(MFI(MFIPds)),"Null","Neutral")));
	MFI_Color		=	IIf(M1,Color_sell,
						IIf(M2,Color_buy,Color_null));
_SECTION_END();


/////////////////////////////////
// ADX Trend Strenght with ADX //
/////////////////////////////////
_SECTION_BEGIN("ADX Signal");
// JSB Lib Version
// INITIALIZATION
	SetBarsRequired(100000, 100000);
//	JSB_InitLib();
// PARAMETERS
	ADX_Parm	=	Param( "ADX Period", 8, 5, 50,1);
	ADX_Parma	=	Param( "ADX Perioda", 15, 5, 50,1);
	ADX_Parmb	=	Param( "ADX Periodb", 25, 5, 50,1);
	ADX_Parmc	=	Param( "ADX Periodc", 35, 5, 50,1);
	ADX_Parmd	=	Param( "ADX Periodd", 50, 5, 50,1);
// FORMULA
//	ADX Buy, Sell & Choppy Signal
	ADX_up		=	MA(C,ADX_Parm) > 0;
	ADX_dn		=	MA(C,ADX_Parm) < 0;
	ADX_ch		=	MA(C,ADX_Parma) < MA(C,ADX_Parmb) AND MA(C,ADX_Parmc) < MA(C,ADX_Parmd);
	ADX_Buy	=	Cross(MA(C,ADX_Parm), MA(C,ADX_Parmb));
	ADX_Sell	=	Cross(MA(C,ADX_Parmb), MA(C,ADX_Parm));
	ADX_Buy	=	ExRem(ADX_Buy, ADX_Sell);
	ADX_Sell	=	ExRem(ADX_Sell, ADX_Buy);
	ADX_bull	=	MA(C,ADX_Parm) > MA(C,ADX_Parmb);
	ADX_bear	=	MA(C,ADX_Parm)> MA(C,ADX_Parma);
// ADX Trend Confirmation Signal
	ADXwk		=	ADX(ADX_Parm) < 25;
	ADXst		=	ADX(ADX_Parm) > 25 AND ADX(ADX_Parm) < 50;
	ADXvs		=	ADX(ADX_Parm) > 50 AND ADX(ADX_Parm) < 75;
	ADXex		=	ADX(ADX_Parm) > 75 AND ADX(ADX_Parm) < 100;
	ADXchoppy	=	ADX(ADX_Parm) < PDI(ADX_Parm) AND ADX(ADX_Parm) < MDI(ADX_Parm);
// VARIABLES
//		TrendScore Count
	IIf(ADX_Buy,i+2,i);
	IIf(ADX_bull,i+1,i);
//	IIf(ADXst,i+1,i);
//		Indicators
	ADX_Status		=	WriteIf(ADX_Buy,"-=BUY=-",
						WriteIf(ADX_bull,"Bullish",
						WriteIf(ADX_bear,"Bearish",
						WriteIf(ADX_Sell,"-=SELL=-","Neutral"))));
	ADX_Color		=	IIf(ADX_Buy,Color_buy,
						IIf(ADX_bull,Color_bull,
						IIf(ADX_bear,Color_bear,
						IIf(ADX_Sell,Color_sell,Color_null))));
	//ADXc_Status	=	WriteIf(ADXwk,"Weak",
	//					WriteIf(ADXst,"Good",
	//					WriteIf(ADXvs,"Strong",
	//					WriteIf(ADXex,"EXCELENT",
	//					WriteIf(ADXchoppy,"Choppy","Neutral")))));
	//ADXc_Color		=	IIf(ADXwk,Color_sell,
	//					IIf(ADXst,Color_bull1,
	//					IIf(ADXvs,Color_bull,
	//					IIf(ADXex,Color_buy,
	//					IIf(ADXchoppy,Color_prev,Color_null)))));
_SECTION_END();


_SECTION_BEGIN("Unnamed 1");


threshold = 5;
uptrend = StochK(39,3) > StochD(39,3,3);
downtrend =StochK(39,3) < StochD(39,3,3);

Buy = uptrend AND H >= Ref(H,-1) + threshold; BuyPrice = Max(O,Ref(H,-1) + threshold);
Sell = downtrend AND L <= Ref(L,-1) - threshold; SellPrice = Min(O,Ref(L,-1) - threshold);

Buy = ExRem(Buy,Sell);
Sell = ExRem(Sell,Buy);
Cover=Buy;
Short=Sell;
SellPrice=ValueWhen(Short,C,1);
BuyPrice=ValueWhen(Buy,C,1);

PlotShapes(IIf(Buy, shapeSquare, shapeNone),colorGreen, 0, L, Offset=-40);
PlotShapes(IIf(Buy, shapeSquare, shapeNone),colorLime, 0,L, Offset=-50);
PlotShapes(IIf(Buy, shapeUpArrow, shapeNone),colorWhite, 0,L, Offset=-45);
PlotShapes(IIf(Sell, shapeSquare, shapeNone),colorRed, 0, H, Offset=40);
PlotShapes(IIf(Sell, shapeSquare, shapeNone),colorOrange, 0,H, Offset=50);
PlotShapes(IIf(Sell, shapeDownArrow, shapeNone),colorWhite, 0,H, Offset=-45);
///////////////////////
// Trend Score Count //
///////////////////////
_SECTION_BEGIN("Trend Score Count");
	TrendScore		=	IIf(V>Vp2,3,0) +
						IIf(V>Vp1,2,0) +
						IIf(V>VRG,1,0) +
						IIf(rg>(arg*2),2,0) +
						IIf(rg>arg,1,0) +
						IIf(rising,1,0) +
						IIf(bullishsign,3,0) +
						IIf(upThrustBar,2,0) +
						IIf(absorption,1,0) +
						IIf(EMAsBuy,1,0) +
						IIf(EMAmBuy,1,0) +
						IIf(EMAlBuy,1,0) +
						IIf(EMA_rc,3,0) +
						IIf(EMA_ac,2,0) +
						IIf(EMA_bl,1,0) +
						IIf(I_buy,2,0) +
						IIf(I_bull,1,0) +
						IIf(T3_buy,1,0) +
						IIf(BB1,1,0) +
						IIf(MACDBull,1,0) +
						//IIf(Aroon,1,0) +
						IIf(CK_upt,2,0) +
						IIf(CK_ups,1,0) +
						IIf(StochKBull,1,0) +
						IIf(RSItOs,1,0) +
						IIf(ARSIOs,1,0) +
						//IIf(R1,1,0) +
						IIf(M2,1,0) +
						IIf(ADX_Buy,2,0);
						IIf(ADX_bull,1,0);
						//IIf(ADXst,1,0);
	ScoreRank		=	100 * TrendScore / 30;
_SECTION_END();
if(Explorer==0)
{
//////////////////////
// Exploration Code //
//////////////////////
_SECTION_BEGIN("Explorer");
// PARAMETERS
	EXPfil_Parm	=	ParamList	( "Filter","All Symbols|Buy Signals|Sell Signals",0);
	EXPvol_Parm	=	Param		( "20 Day Min. Vol. Cap.", 50000,0,100000000,1000);
	EXPvol_Parm	=	Param		( "Min. Price Close",15,0,5000000,1);
// FILTER
Filter = 1;
// DISPLAY COLUMNS
	//AddColumn	(High52,"52 Week High");
	//AddColumn	(Low52,"52 Week Low");
	AddColumn		(C,"P.Close",1.2,IIf(C>Ref(C,-1),		colorGreen,colorRed));
	AddColumn		(V,"Volume",1,IIf(V>Ref(V,-1),			colorGreen,colorRed));
	AddTextColumn	(VPAv_Status,"VPA Volume",1,			VPAv_Color,BColor_vpa);
	AddTextColumn	(VPAs_Status,"VPA Spread",1,			VPAs_Color,BColor_vpa);
	AddTextColumn	(VPAc_Status,"VPA Close",1,				VPAc_Color,BColor_vpa);
	AddTextColumn	(VPAz_Status,"VPA Zone",1,				VPAz_Color,BColor_vpa);
	AddTextColumn	(VPAst_Status,"VPA Status",1,			VPAst_Color,BColor_vpa);
	AddTextColumn	(EMAs_Status,"EMA Short",1,				EMAs_Color,BColor_mas);
	AddTextColumn	(EMAm_Status,"EMA Mid",1,				EMAm_Color,BColor_mam);
	AddTextColumn	(EMAl_Status,"EMA Long",1,				EMAl_Color,BColor_mal);
	AddTextColumn	(EMAp_Status,"EMA Trend",1,				colorWhite,EMAp_Color);
	AddTextColumn (I_Status,"I Signal",1,					colorWhite,I_Color);
	AddTextColumn (T3_Status,"T3 Signal",1,				colorWhite,T3_Color);
	AddTextColumn	(BB_Status,"Bol. Band",1,				colorWhite,BB_Color);
	AddTextColumn	(MACD_Status,"MACD",1,					colorWhite,MACD_Color);
	AddTextColumn	(RSIt_Status,"MACD(RSI)",1,				colorWhite,RSIt_Color);
	//AddTextColumn	(AROON_Status,"Aroon",1,			colorWhite,AROON_Color);
	//AddTextColumn	(WAD_Status,"Williams A/D",1,		colorWhite,WAD_Color);
	AddTextColumn (COPPOCK_Status,"Coppock",1,			colorWhite,COPPOCK_Color);
	AddTextColumn	(STOCH_Status,"Stochastic",1,			colorWhite,STOCH_Color);
	AddTextColumn	(ARSI_Status,"ARSI",1,					colorWhite,ARSI_Color);
	//AddTextColumn	(RSI_Status,"RSI",1,					colorWhite,RSI_Color);
	AddTextColumn	(MFI_Status,"MFI(14)",1,				colorWhite,MFI_Color);
	AddTextColumn	(ADX_Status,"DMX (ADX)",1,				colorWhite,ADX_Color);
	//AddTextColumn	(ADXc_Status,"ADX Confirm",1,		colorWhite,ADXc_Color);
	//AddColumn		(RSIt,"TEST L",1,						colorWhite,colorBlack);
	AddColumn		(TtD_Change,"P/L %",1.2,IIf(TtD_Change>0,	colorGreen,colorRed));
	AddColumn		(Beta,"( ß )",1.2,IIf(Beta>0,colorGreen,colorRed));
	AddColumn		(ScoreRank,"% Rank",1.0,colorWhite,colorBlue);
_SECTION_END();
}
else
{

AlertIf( Buy, "", "BUY @ " + C, 1 );
AlertIf( Sell, "", "SELL @ " + C, 2 );
no=Param( "Swing", 8, 1, 55 );
tsl_col=ParamColor( "Color", colorLightGrey );
res=HHV(H,no);
sup=LLV(L,no);
avd=IIf(C>Ref(res,-1),1,IIf(C<Ref(sup,-1),-1,0));
avn=ValueWhen(avd!=0,avd,1);
tsl=IIf(avn==1,sup,res);

//no =  Optimize("TSL",Param("A (Change To Optimise)",10, 1, 55 ,1),1, 55 ,1);

tsl_col=ParamColor( "Color", colorLightGrey );
res=HHV(H,no);
sup=LLV(L,no);
avd=IIf(C>Ref(res,-1),1,IIf(C<Ref(sup,-1),-1,0));
avn=ValueWhen(avd!=0,avd,1);
dtsl=IIf(avn==1,sup,res);
SellPrice=ValueWhen(Short,C,1);
BuyPrice=ValueWhen(Buy,C,1);
Long=Flip(Buy,Sell);
Shrt=Flip(Short,Cover);
Relax = NOT Long AND NOT Buy AND NOT shrt AND NOT Sell AND NOT Sell AND NOT Cover;
SellSL=ValueWhen(Short,DTSL,1);
BuySL=ValueWhen(Buy,DTSL,1);
BuyDifference= BuyPrice - BuySL;
SellDifference = SellSL - SellPrice;

tar1 = IIf(Buy OR Long AND NOT Relax AND NOT Sell AND NOT Cover, (BuyPrice + BuyDifference), (SellPrice - SellDifference));
tar2 = IIf(Buy OR Long AND NOT Relax AND NOT Sell AND NOT Cover, (BuyPrice + (2*BuyDifference)), (SellPrice - (2*SellDifference)));
tar3 = IIf(Buy OR Long AND NOT Relax AND NOT Sell AND NOT Cover, (BuyPrice + (4*BuyDifference)), (SellPrice - (4*SellDifference)));
// User-defined parameter for EMA periods

EMA_Type		= Param("EMA-1, TEMA-2, JMA-3", 2, 1, 3, 1);
EMA_prds 		= Param("EMA_periods", 7, 1, 30, 1);
Std_MACD		= Param("Standard MACD? No-0, Yes-1", 1, 0, 1, 1);
Plot_fashion	= Param("Bar+Arrows-1, Impulse  Bars-2", 2, 1, 2, 1);


// Allow user to define Weekly and Monthly Ribbon Location and Height
WR_P1 = Param("Weekly Ribbon Location", -10.5, -1000, 1000, 0.1);
WR_P2 = Param("Weekly Ribbon Height", 366.5, -0.001, 500, 0.1);

MR_P1 = Param("Monthly Ribbon Location", 5.2, -1000, 1000, 0.1);
MR_P2 = Param("Monthly Ribbon Height", 199, -0.001, 500, 0.1);


// Compute EMA and MACD Histogram
if(EMA_Type == 1)
{
	DayEMA	= EMA(Close, EMA_prds);
}
if (EMA_Type == 2)
{
	DayEMA	= TEMA(Close, EMA_prds);
}

if(EMA_Type == 3)
{
	// Line below to be used with Jurik JMA
	// DayEMA = JurikJMA(C, EMA_Prds);
}

Histogram	= MACD() - Signal();

// Determine if we have an Impulse UP, DOWN or None
Impulse_Up		=	DayEMA > Ref(DayEMA, -1) AND Histogram > Ref(Histogram, -1);
Impulse_Down	=	DayEMA < Ref(DayEMA, -1) AND Histogram < Ref(Histogram, -1);
Impulse_None		=	(NOT Impulse_UP) AND (NOT Impulse_Down);

// Compute Weekly MACD and determine whether rising or falling
// Note: uses "non-standard"  parameters!
TimeFrameSet(inWeekly);

if (Std_MACD == 0)
{
MACD_val		=	MACD(5, 8);
Signal_val		=	Signal(5, 8, 5);
}
else
{
MACD_val		=	MACD(12, 26);
Signal_val		=	Signal(12, 26, 9);
}

Hist_in_w		=	MACD_val - Signal_val;

wh_rising = Hist_in_w > Ref(Hist_in_w, -1);
wh_falling = Hist_in_w < Ref(Hist_in_w, -1);

TimeFrameRestore();

// Now get Monthly MACD Histogram....
TimeFrameSet(inMonthly);
MACD_val		=	MACD(5, 8);
Signal_val		=	Signal(5, 8, 5);
Hist_in_m		=	MACD_val - Signal_val;

mh_rising = Hist_in_m > Ref(Hist_in_m, -1);
mh_falling = Hist_in_m < Ref(Hist_in_m, -1);

TimeFrameRestore();

wh_rising 		= TimeFrameExpand( wh_rising, inWeekly, expandLast );
wh_falling 		= TimeFrameExpand( wh_falling, inWeekly, expandLast);
mh_rising 	= TimeFrameExpand(mh_rising, inMonthly, expandLast);
mh_falling 	= TimeFrameExpand(mh_falling, inMonthly, expandLast);

kol 	= IIf( wh_rising, colorGreen,  IIf(wh_falling, colorRed,
colorLightGrey));
mkol 	= IIf( mh_rising, colorBlue,  IIf(mh_falling, colorYellow,
colorLightGrey));

// Plot them all!
if (Plot_fashion == 1)
{
	Plot(Close, "Close", colorTeal, styleBar);
	PlotShapes(shapeUpArrow * Impulse_Up, colorBlue, 0, Low, -12);
	PlotShapes(shapeDownArrow * Impulse_Down, colorRed, 0, High, -12);
	PlotShapes(shapeSmallCircle * Impulse_None, colorWhite, 0, High, 5);
}
else
{
	bar_kol	=	IIf(impulse_UP, colorBlue, IIf(impulse_Down, colorRed,
colorWhite));
	//Plot(C, "Close", bar_kol, styleBar);
}

Plot(10, "ribbon", kol, styleOwnScale|styleArea|styleNoLabel, WR_P1, WR_P2);//Weekly trend

Plot(10, "ribbon", mkol, styleOwnScale|styleArea|styleNoLabel, MR_P1,
MR_P2);	// Monthly Trend

// Explorer Section
// Determine if Impulse status is bullish, neutral or bearish.  Display as Text Column.

Impulse_State		=	WriteIf(Impulse_Up, "Bul", WriteIf(Impulse_Down,
"Bear", "Neut"));

// Set the background color for Impulse Status Column
Impulse_Col		=	IIf(Impulse_Up, colorGreen, IIf(Impulse_Down, colorRed,
colorLightGrey));

// Determine Weekly Trend. Display as Text Column
Weekly_Trend		=	WriteIf(wh_rising, "Rising", WriteIf(wh_falling, "Falling",
"Flat!"));
Weekly_Col		=	IIf(wh_rising, colorGreen, IIf(wh_falling, colorRed,
colorLightGrey));

// Determine Monthly Trend. Display as Text Column
Monthly_Trend	=	WriteIf(mh_rising, "Rising", WriteIf(mh_falling, "Falling",
"Flat!"));
Monthly_Col		=	IIf(mh_rising, colorGreen, IIf(mh_falling, colorRed,
colorLightGrey));

// Determine how many bars has the current state existed
bars_in_bull	=	Min(BarsSince(impulse_none), BarsSince(impulse_down));
bars_in_bear	=	Min(BarsSince(impulse_up), BarsSince(impulse_none));
bars_in_neut	=	Min(BarsSince(impulse_down), BarsSince(impulse_up));

// Set a single variable to show number of bars in current state depending upon

// actual Impulse Status - Bullish, Bearish or Neutral
bars_in_state	=	IIf(Impulse_Up,bars_in_bull, IIf(Impulse_down, bars_in_bear,bars_in_neut));
//AddColumn(Close,"Close",1.2);
// Columns for display in Explorer
//AddTextColumn(Impulse_State, "Status", 1, colorWhite, Impulse_Col);
//AddColumn(bars_in_state, "Bars", 1, colorWhite, Impulse_col);
//Action = WriteIf(Buy, "BUY", WriteIf(Sell, "SELL", "   "));
//i=0;
//bars_in_statee	=	IIf(Buy, BarCount[i], IIf(Sell, BarCount[i],bars_in_neut));
//bars=BarsSince(IIf(Buy+BarCount+1),OR( Sell-BarCount+1));

AddColumn(bars_in_state ,"Bars", 1, colorWhite, Impulse_col);
//AddTextColumn(Weekly_Trend, "W Trend", 1, colorWhite, Weekly_Col);
//AddTextColumn(Monthly_Trend, "M Trend", 1, colorWhite, Monthly_Col);

//Filter = 1;

_SECTION_END();
//Settings for exploration

H1 = SelectedValue( TimeFrameGetPrice( "H", inDaily, -1 ) );
L1 = SelectedValue( TimeFrameGetPrice( "L", inDaily, -1 ) );
C1 = SelectedValue( TimeFrameGetPrice( "C", inDaily, -1 ) );
H2 = SelectedValue( TimeFrameGetPrice( "H", inDaily, 0 ) );
L2 = SelectedValue( TimeFrameGetPrice( "L", inDaily, 0 ) );
O1 = SelectedValue( TimeFrameGetPrice( "open", inDaily, 0 ) );
F4 = 0;
D1 = ( H1 - L1 );
D2 = ( H2 - L2 );
F1 = D1 * 0.433;
F2 = D1 * 0.766;
F3 = D1 * 1.35;
if ( D2 <= F1 )
    F4 = F1;
else
    if ( D2 <= F2  )
        F4 = F2;
    else
        F4 = F3;

S_P = ( O1 - F4 );

B_P = ( O1 + F4 );

BP = ( L2 + F4 );

BPTGT = ( BP + ( BP * .0065 ) );//.0015 brokerage

BPSTPLS = ( BP - ( BP * .0085 ) );

SP = ( H2 - F4 );

SPTGT = ( SP - ( SP * .0065 ) );

SPSTPLS = ( SP + ( SP * .0085 ) );


p = ( H1 + L1 + C1 ) / 3;

s1 = ( H1 );

r1 = ( L1 );

r2 = SelectedValue( L2 );

s2 = SelectedValue( H2 );

//CONDITION

if (ParamToggle("Tooltip shows", "All Values|Only Prices"))
{
  ToolTip = StrFormat("Open: %g\nHigh:  %g\nLow:   %g\nClose:  %g (%.1f%%) \nVolume: " + NumToStr(V, 1), O, H, L, C, SelectedValue(ROC(C, 1)));
}

//space = Param("Space on Chart", 20,  - 15, 50, 1);
//GraphXSpace = space;
//SetChartBkColor(ParamColor("Background Color", colorBlack));

// ================= Rasheed's original code (with Lookback and Shift default set to his specs) =================

H0 = H;
L0 = L;
C0 = C;
O0 = O;

Lookback = Param("LookBack", 10, 10, 50, 1); // Default for interday commodity currency trading
shift = Param("Shift", 5, 1, 50, 1); // ?
x0 = LastValue(Cum(1));
x1 = x0 - shift;
H = Ref(H,  - shift + 1);
L = Ref(L,  - shift + 1);
H1 = LastValue(Ref(HHV(H, Lookback),  - 1));
L1 = LastValue(Ref(LLV(L, Lookback),  - 1));

Plot(H1, "H1", colorYellow);
Plot(L1, "L1", colorYellow);

H = H0;
L = L0;
C = C0;
O = O0;

up = Cross(H, H1)AND Cum(1) > x1;
dn = Cross(L1, L)AND Cum(1) > x1;

//Plot(C, "Close", IIf(Cum(1) > x1 - Lookback AND Cum(1) <= x1, colorBlue, IIf(Up, colorBrightGreen, IIf(Dn, colorRed, IIf(C > O, colorGreen, colorRed)))), 64);
//PlotShapes(shapeDownArrow *(Cum(1) == x1 + 1), colorBlue);

// ======================= Exploration and Signal Code =================
TRIGGER = ParamToggle("Trigger ", "CLOSE|HIGH OR LOW");


XH1 = Cross(C, H1);
XL1 = Cross(L1, C);
XH2 = Cross(H, H1);
XL2 = Cross(L1, L);

if (TRIGGER == 0)
{
  //Buy = XH1;
  //Sell = XL1;
}

else
{
  //Buy = XH2;
  //Sell = XL2;
}


TradeDisplay = ParamToggle("Remove Extra Trades?", "No|Yes");

if(TradeDisplay != 0){
	//Buy = ExRem(Buy, Sell);
  	//Sell = ExRem(Sell, Buy); // THIS WILL REMOVE EXESS SIGNALS ON A CHART OR IN AN EXPLORATION
}

Filter = Buy OR Sell;
Action = WriteIf(Buy, "BUY", WriteIf(Sell, "SELL", "   "));

//AddTextColumn(IndustryID(1), "Industry Sector  ", 30.0, colorBlue, colorYellow);
AddColumn(C, "Last ", 2.2, colorWhite, colorBlue);
AddTextColumn(Action, "Action", 8.0, IIf(XH1, colorDarkGreen, colorDarkRed), colorWhite);
AddColumn(IIf(XH1, H1, L1), "BREAKOUT LEVEL", 3.2, colorYellow, IIf(XH1, colorDarkGreen, colorDarkRed));

// -----------------------------------------------------------------------------------  Arrow signals --- FOR TRADES  ----------------------------------------------------------
//PlotShapes(Buy *shapeUpArrow, colorBrightGreen, 0, L /* ENTRY_TRAILARRAY */,  - 30);
//PlotShapes(Sell *shapeDownArrow, colorLightYellow, 0, H,  - 30);
_SECTION_END();


_SECTION_BEGIN("Volume At Price");
PlotVAPOverlay(Param("Lines", 1000, 100, 1000, 10), Param("Width", 15, 1, 100, 1), ParamColor("Color", colorBlue), ParamToggle("Side", "Left|Right", 1) | 4 *ParamToggle("Z-order", "On top|Behind", 1));

_SECTION_END();
//Filter =  Buy OR Sell;

//AddColumn( IIf( Buy, 66, 1 ), "Buy", formatChar, 1, bkcolor = IIf( Buy, 43, 33 ) );

//AddColumn( IIf( Sell, 83, 1 ), "Sell", formatChar, 1, bkcolor = IIf( Sell, 25, 32 ) );


//AddColumn( C, "CMP", 1.2, colorDefault, colorLightBlue );

//AddColumn( BP, "SELL PRICE", 1.2, colorDefault, colorGreen );

//AddColumn( BPTGT, "TGT PRICE", 1.2, colorDefault, colorBrown );

//AddColumn( BPSTPLS, "STPLS BUY", 1.2, colorDefault, colorRed );

AddColumn( p, "PIVOT", 1.2, colorDefault, colorYellow );

//AddColumn( SPSTPLS, "STPLS SELL", 1.2, colorDefault, colorRed );

//AddColumn( SP, "SELL PRICE", 1.2, colorDefault, colorGreen );

//AddColumn( SPTGT, "TGT PRICE", 1.2, colorDefault, colorBrown );


//Settings for exploration

Filter=Buy OR Short;
AddColumn( IIf( Buy, 66 , 83 ), "Signal", formatChar, colorDefault, IIf( Buy , colorGreen, colorRed ) );
AddColumn(Close,"Entry Price",1.4, colorDefault, IIf( Buy , colorGreen, colorRed ));
AddColumn(dtsl,"Stop Loss",1.4, colorDefault, IIf( Buy , colorGreen, colorRed ));
AddColumn(tar1,"Target 1",1.4, colorDefault, IIf( Buy , colorGreen, colorRed ));
AddColumn(tar2,"Target 2",1.4, colorDefault, IIf( Buy , colorGreen, colorRed ));
AddColumn(tar3,"Target 3",1.4, colorDefault, IIf( Buy , colorGreen, colorRed ));

AddColumn(ROC(V,1),"RVol ",1.2, IIf(ROC(V,1) > 0, colorGreen, colorRed));
AddColumn(Volume,"Volume",1.0, colorDefault, IIf ((Volume > 1.25 * EMA( Volume, 34 )),colorBlue,colorYellow));
AddColumn( H1, "PRE-HIGH" );

AddColumn( L1, "PRE-LOW" );

AddColumn( D1, "PRE-DIFF" );

AddColumn( F1, "0.433" );

AddColumn( F2, "0.766" );

AddColumn( F3, "1.35" );

AddColumn( H2, "D-HIGH" );

AddColumn( L2, "D-LOW" );

AddColumn( D2, "D-DIFF" );

AddColumn( F4, "SELECT FACT" );

AlertIf( Buy , "SOUND C:\\Windows\\Media\\chimes.wav", "Audio alert", 2 );
AlertIf( Sell , "SOUND C:\\Windows\\Media\\alert.wav", "Audio alert", 2 );
}

Short=Sell;
Cover=Buy;
Long=Flip(Buy,Sell);
Shrt=Flip(Short,Cover);
SellPrice=ValueWhen(Short,C,1);
BuyPrice=ValueWhen(Buy,C,1);
Edc=(
WriteIf (Buy AND Ref(shrt,-1), " BUY @ "+C+"  ","")+
WriteIf (Sell AND Ref(Long,-1), " SEll @ "+C+"  ","")+
WriteIf(Sell , "Last Trade Profit Rs."+(C-BuyPrice)+"","")+
WriteIf(Buy  , "Last Trade Profit Rs."+(SellPrice-C)+"",""));

//============== TITLE ==============


_SECTION_BEGIN("Tops and bottom");

pd = Param("Periods",13,5,144,1);
pds = 2*pd-1;//     (Adjustment for Wilders MA)
aa = Close-Ref(Close,-1);
uu = EMA(Max(0,aa),pds);
dd=  EMA((Max(0,0-aa)),pds);

rf = IIf(C>2,1000,10000);

c1 = Param("Upper Level",70,50,90,1);
qq1 =100/(100-c1)-1;
ff1 = qq1*dd-uu;
ff2 = ff1/qq1;
f1 = Max(ff1,ff2);
UL = Close + f1*(pds-1)/2;
UL = IIf(UL>C,floor(UL*rf),ceil(UL*rf))/rf;

c2 = Param("Equilibrium",50,50,50,0);
qq2 =100/(100-c2)-1;// [=1]
ff = dd-uu;
MM = Close + ff*(pds-1)/2;
MM = IIf(MM>C,floor(MM*rf),ceil(MM*rf))/rf;

c3 = Param("Lower Level",30,10,50,1);
qq3 =100/(100-c3)-1;
ff1 = qq3*dd-uu;
ff2 = ff1/qq3;
f3 = Min(ff1,ff2);
LL = Close + f3*(pds-1)/2;
LL = IIf(LL>C,floor(LL*rf),ceil(LL*rf))/rf;

band = Param("band width",4,0,15,0.25);
mmu = MM+band;
mmd = MM-band;

_SECTION_BEGIN("Pivot calc");

TimeFrameSet( in15Minute*2 );
DH=Ref(H,-1);
DL=Ref(L,-1);
DC=Ref(C,-1);


pd = ( DH+ DL + DC )/3;
sd1 = (2*pd)-DH;
sd2 = pd -(DH - DL);
sd3 = Sd1 - (DH-DL);
rd1 = (2*pd)-DL;
rd2 = pd +(DH -DL);
rd3 = rd1 +(DH-DL);

if(ChangeTitle==1)
{

_SECTION_BEGIN("Title");
no=Param( "Swing", 6, 1, 55 );
res=HHV(H,no);
sup=LLV(L,no);
avd=IIf(C>Ref(res,-1),1,IIf(C<Ref(sup,-1),-1,0));
avn=ValueWhen(avd!=0,avd,1);
tsl=IIf(avn==1,sup,res);
dec = (Param("Decimals",2,0,7,1)/10)+1;
if( Status("action") == actionIndicator )
(
Title = EncodeColor(55)+  Title = Name() + "     " + EncodeColor(32) + Date() +
"      " + EncodeColor(5) + "{{INTERVAL}}  " +
	EncodeColor(55)+ "     Open = "+ EncodeColor(52)+ WriteVal(O,dec) +
	EncodeColor(55)+ "     High = "+ EncodeColor(5) + WriteVal(H,dec) +
	EncodeColor(55)+ "      Low = "+ EncodeColor(32)+ WriteVal(L,dec) +
	EncodeColor(55)+ "    Close = "+ EncodeColor(52)+ WriteVal(C,dec)+
	EncodeColor(55)+ "    Volume = "+ EncodeColor(52)+ WriteVal (V ,1.25)


+"\n"+EncodeColor(colorBrightGreen)+

WriteIf (Buy , "Signal: Go Long - Entry Price: "+WriteVal(C)+" - Traget: "+WriteVal((BuyPrice-tsl)+BuyPrice)

+" - StopLoss:"+WriteVal(tsl)+"  "

,"")+

"\n"+EncodeColor(colorRed)+
WriteIf (Sell , "Signal: Go Short - Entry Price: "+WriteVal(C)+" - Target: "+WriteVal((tsl-SellPrice)-SellPrice)+" - StopLoss:"+WriteVal(tsl)+" ","")+
EncodeColor(colorTurquoise)+
WriteIf(Long AND NOT Buy, "Trade: Long - Entry Price: "+WriteVal((BuyPrice))+" - Profit: "+WriteVal((C-BuyPrice))+" "+EncodeColor(colorLime)+"Let your profit runs!","")+
EncodeColor(colorLightOrange)+
WriteIf(shrt AND NOT Sell, "Trade: Short - Entry Price: "+WriteVal((SellPrice))+" - Profit: "+WriteVal((C-SellPrice))+"  - "+EncodeColor(colorLime)+"Let your profit runs!","")+

EncodeColor(colorBrightGreen)+   "


\n R3 : "+
EncodeColor(colorWhite)+RD3+
EncodeColor(colorBrightGreen)+   "\n R2 : "+
EncodeColor(colorWhite)+RD2+
EncodeColor(colorBrightGreen)+   "\n R1 : " +
EncodeColor(colorWhite)+RD1 +
EncodeColor(colorBrightGreen)+  "     UP TGT   : "+
EncodeColor(colorWhite)+UL+
EncodeColor(colorBlue)+   "\n Pivot : "+
EncodeColor(colorWhite)+pd+
EncodeColor(colorBlue)+   "    MIDPOINT : "+
EncodeColor(colorWhite)+MM+
EncodeColor(colorRed)+   "\n S1 : "+
EncodeColor(colorWhite)+SD1   +
EncodeColor(colorRed)+    "     BOT TGT  : "+
EncodeColor(colorWhite)+LL+
EncodeColor(colorRed)+   "\n S2 : "+
EncodeColor(colorWhite)+SD2+
EncodeColor(colorRed)+   "\n S3 : "+
EncodeColor(colorWhite)+SD3
);
_SECTION_END();
}

if(Buyselllable==1)
{
dist = 1.5*ATR(10);
dista = 0.5*ATR(10);
for( i = 0; i < BarCount; i++ )
{

if( Buy[i] ) PlotText( "Buy  \n"+C[i] , i, L[ i ]-dist[i], colorBlack,colorGreen );
if( Sell[i] ) PlotText( "Sell \n"+C[i], i, H[ i ]+dist[i], colorBlack, colorRed );
//if( Buy[i] ) PlotText( "B" , i, L[ i ]-dist[i], colorBlack,colorGreen );
//if( Sell[i] ) PlotText( "S" , i, H[ i ]+dist[i], colorBlack, colorRed );
if( Sell[i] ) PlotText( "Top" , i, H[ i ]+dista[i], colorGreen, colorBlack );
if( Buy[i] ) PlotText( "Bottom", i, L[ i ]-dista[i], colorRed, colorBlack );


}  }
5 comments
Leave Comment
Please login here to leave a comment.
error 718 x1=IIf(Cloc=0,arg,x);
and then, too,
Dear Sir
Please mail AFL formula to my mail ID: bchandra1981@gmail.com , Thanks in advance
error
Interesting Exploration. However I would like to change “Filter” to:
Filter = C <60 AND C >2 AND Volume > 80000 AND C> Ref(C,-1);
I tried to do but it didn’t work. Let know how to accomplish as my target isn’t extremely high price stocks.
Thanks
Dick Hoierman
Giving Error in Line no 718.
x1=IIf(Cloc=0,arg,x);
Warning 501. Assignment within Conditional. Did you mean == instead of =?
How to solve ?
Thanks in advance.
Raja