Volume Delivery for Amibroker (AFL)
m3trail almost 16 years ago Amibroker (AFL)
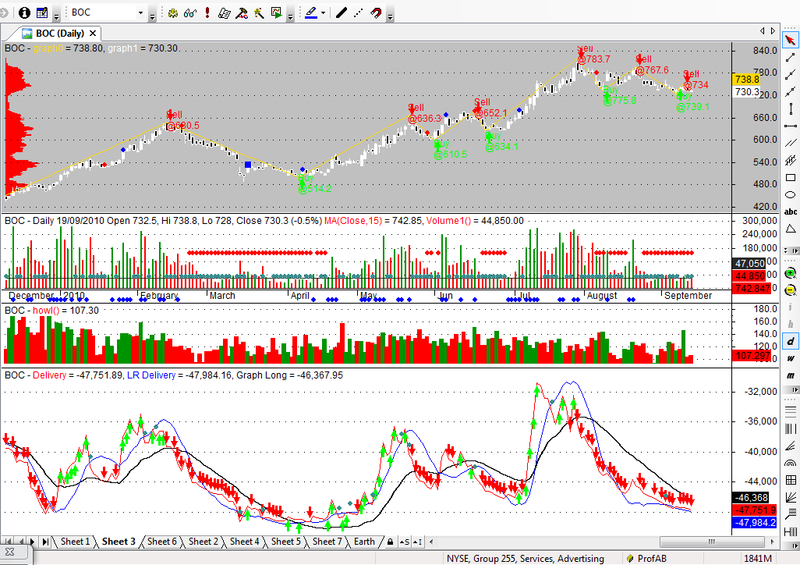
This is volume accumulation indicator. need some face uplift but works fine.
Screenshots
Indicator / Formula
Copy & Paste Friendly
//Volume Delivery V1.1
//By M3trail@yahoo.com

_SECTION_BEGIN("DVI");
function DailyVolumeIndicator()
{
  midpoint = ( High + Low ) / 2;

  dv = Volume * (( Close - midpoint ) / midpoint);

  return Cum( dv );
}

Plot( DailyVolumeIndicator(), "Delivery", ParamColor( "Color", ColorCycle ) );


_SECTION_END();

_SECTION_BEGIN("Linear Regression");
P = ParamField("Price field",-1);
Periods = Param("Periods", 20, 2, 300, 1, 10 );
Plot( LinearReg( P, Periods ), "LR Delivery", ParamColor( "Color", colorCycle ), ParamStyle("Style") );
_SECTION_END();

tdown=( LinearReg( DailyVolumeIndicator(), Periods ))<Ref(( LinearReg( DailyVolumeIndicator(), Periods )),-1) AND (DailyVolumeIndicator()<Ref(DailyVolumeIndicator(),-1));
tup=( LinearReg( DailyVolumeIndicator(), Periods ))>Ref(( LinearReg( DailyVolumeIndicator(), Periods )),-1) AND (DailyVolumeIndicator()>Ref(DailyVolumeIndicator(),-1));
xup= Cross(DailyVolumeIndicator(),( LinearReg( DailyVolumeIndicator(), Periods )));
Buy=(tup OR xup) AND NOT ( LinearReg( DailyVolumeIndicator(), Periods ))<Ref(( LinearReg( DailyVolumeIndicator(), Periods )),-1);
xdown=Cross(( LinearReg( DailyVolumeIndicator(), Periods )),DailyVolumeIndicator()) ;
Sell=tdown OR xdown AND NOT ( LinearReg( DailyVolumeIndicator(), Periods ))>Ref(( LinearReg( DailyVolumeIndicator(), Periods )),-1);
PlotShapes (IIf(Buy,shapeUpArrow,shapeNone) ,colorBrightGreen);
PlotShapes (IIf(Sell,shapeDownArrow,shapeNone) ,colorRed);
PlotShapes (IIf(xdown,shapeSmallCircle + shapePositionAbove,shapeNone) ,colorTeal);

_SECTION_BEGIN("TEMA");
P = ParamField("Price field",-1);
Periods = Param("Periods", 60, 2, 300, 1, 10 );
Plot( TEMA( P, Periods ), "Graph Long", colorBlack, styleThick );
_SECTION_END();
1 comments
Leave Comment
Please login here to leave a comment.
SIR IT HAS NOT SHOWING ANY THINK SO PLS GUIDE ME HOW TO RESOLVE THE PROBLEM I LIKE TO SEE THE INDICTORE