SAR in multiple timeframe for Amibroker (AFL)
mahesh.aranake almost 16 years ago Amibroker (AFL)
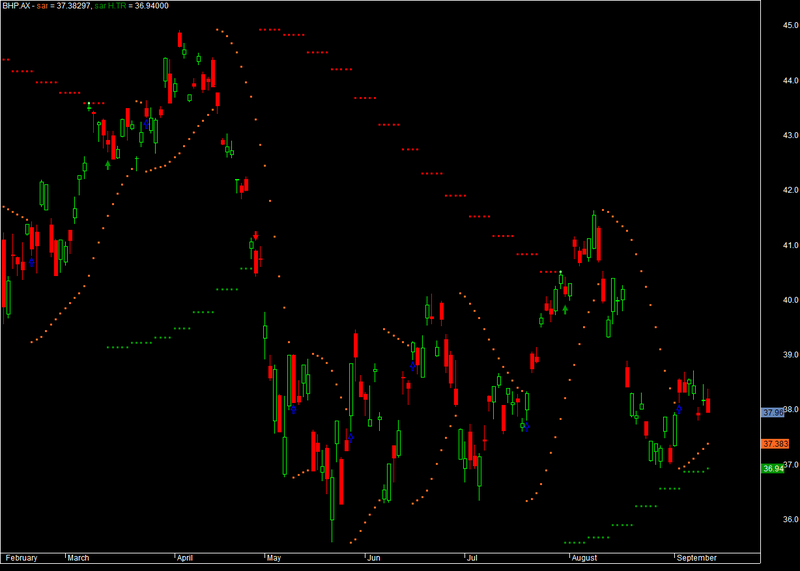
Interesting modification which allows viewing of daily and weekly status of SAR on same chart
Screenshots
Indicator / Formula
Copy & Paste Friendly
_SECTION_BEGIN("SAR in multitimeframe");

Plot(C,"",3,64);

A1=SAR(0.02,0.2);
Cond3=Cross(C,A1);
Cond4=Cross(A1,C);
Plot(A1, "sar", colorOrange, 24 );
PlotShapes(Cond3*shapeHollowUpArrow,colorBlue,0,L,-10);
PlotShapes(Cond4*shapeHollowDownArrow,colorBlack,0,H,-10);


TimeFrameSet(inWeekly);
A=SAR(0.02,0.2);
TimeFrameRestore();
K = TimeFrameExpand(A, inWeekly);
Cond1=Cross(C,K);
Cond2=Cross(K,C);
col = IIf(K < L,colorGreen,IIf(K > H,colorRed,colorWhite));
Plot(K, "sar H.TR", col, 24 );
PlotShapes(Cond1*shapeUpArrow,colorGreen,0,L,-20);
PlotShapes(Cond2*shapeDownArrow,colorRed,0,H,-20);

Buy=Cond1 AND Cond3;
Sell=Cond2 AND Cond4;
Buy=ExRem(Buy,Sell);
Sell=ExRem(Sell,Buy);
PlotShapes(Buy*shapeUpTriangle,colorGreen,0,L,-35);
PlotShapes(Sell*shapeDownTriangle,colorRed,0,H,-35);
_SECTION_END();
0 comments
Leave Comment
Please login here to leave a comment.