Dynamic Traders Index for Amibroker (AFL)
mahesh.aranake almost 16 years ago Amibroker (AFL)
Another interesting adaption I found by Karma on karthik’s site
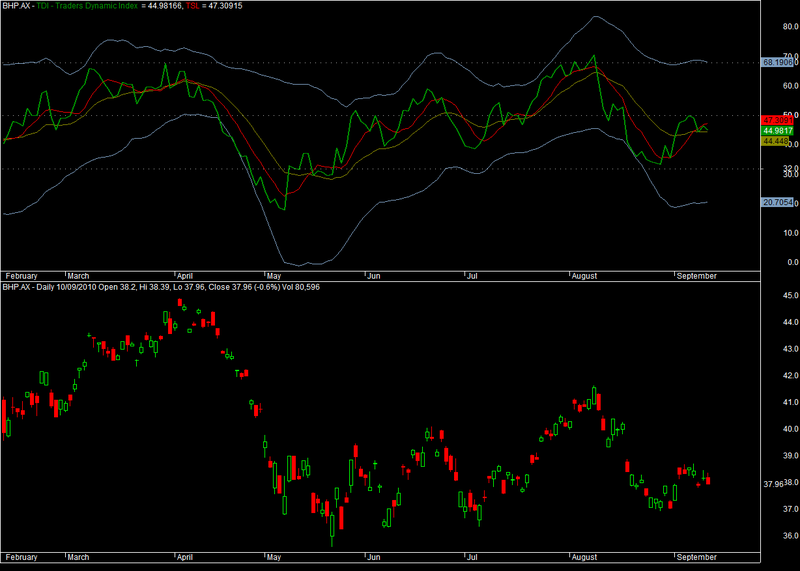
Blue bands show a strength of the trend — the wider they are, the stronger is the trend.
Yellow line indicates the trend’s direction change — when it bounces of 32 level, trend goes bullish, when it bounces down from 68 level, trend goes bearish.
Green and red lines Signal for the long position — if the green one intersects the red one from below, and — for Short position, when the red one crosses the green line from below.
Screenshots
Indicator / Formula
Copy & Paste Friendly
_SECTION_BEGIN("Dynamic Traders Index");
PlotGrid(32, colorLightGrey);
PlotGrid(50, colorLightGrey);
PlotGrid(68, colorLightGrey);
a = DEMA(RSI(13),2);
b = MA(a,7);
bh = DEMA(a,34)+2*(StDev(a,34));
bl = DEMA(a,34)-2*(StDev(a,34));
bm = (bh+bl)/2;

Plot(a, "TDI - Traders Dynamic Index ", colorGreen, styleThick);
Plot(b,"TSL", colorRed);

Plot( bh , "", colorLightBlue);
Plot( bl , "", colorLightBlue);
Plot(bm,"", colorDarkYellow);


_SECTION_END();
0 comments
Leave Comment
Please login here to leave a comment.