Volatility Stop for Amibroker (AFL)
taifur_pavel almost 16 years ago Amibroker (AFL)
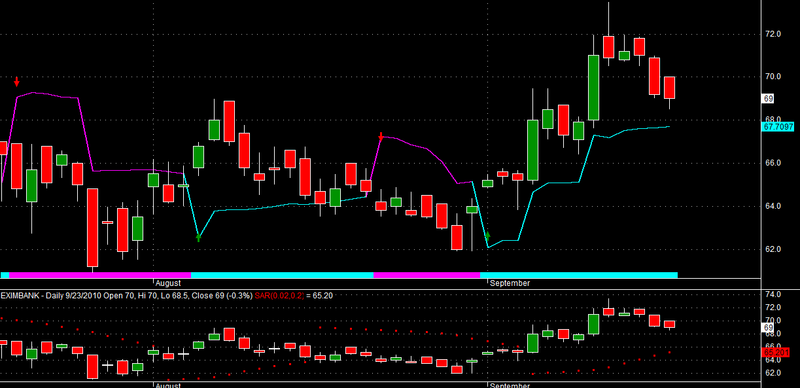
Volatility Stop fixed buy/short for backtesting and added options for ami 5.00
Screenshots
Indicator / Formula
Copy & Paste Friendly
_SECTION_BEGIN("Volitility Stop");
// fcVS
//
// volatility stop
//
// version :1.0  // first release
// version :1.1	// fixed buy/short for backtesting and added options

SetBarsRequired(1000000, 1000000);
SetChartOptions(2,chartShowArrows|chartShowDates);
SetTradeDelays(0,0,0,0);

period	= Param("Period", 13, 1, 240, 1);
mult	= Param("Multiplier", 1.7, 1, 240, 0.1);
showPrice  = ParamToggle("Show Price","No|yes",1);
showArrows = ParamToggle("Show Arrows","No|yes",1);
showRibbon = ParamToggle("Show Ribbon","No|yes",1);

f=ATR(period);

VS[0] = Close[0];
trend[0] = 0;
HighC[0]=0;
Lowc[0]=0;

for( i = period+1; i < BarCount; i++ )
{

  vs[i]	= vs[i-1];
  trend[i]	= trend[i-1];
  highC[i]	= HighC[i-1];
  lowc[i]	= lowc[i-1];

	if ((trend[i]>=0) && ( C[i] <VS[i] ))
	{
			trend[i] =-1;
			HighC[i] = C[i];
			lowc[i] = C[i];
	}

	if ((trend[i]<=0) && (C[i] >VS[i]))
	{
			trend[i]=1;
			HighC[i] = C[i];
			lowc[i] = C[i];
	}

	if (trend[i]==-1)
	{
		if (C[i]<lowc[i]) lowc[i] = C[i];
     VS[i]= lowc[i]+ (mult*f[i]);
	}


	if (trend[i]==1)
	{
		if (C[i]>HighC[i]) HighC[i] = C[i];
     VS[i]= HighC[i]-(mult*f[i]);
	}

}


Buy=Cross(Trend,0);
Sell=Cross(0, Trend);
Short = Sell;
Cover = Buy;

if (ShowPrice) Plot(Close,"Close",colorWhite,styleCandle);
Plot(VS, "Vol Stop",IIf(trend==1,10,11 ),styleThick);

mkol 	= IIf( Trend==1, 10,  11);
if (ShowRibbon) Plot(5, "ribbon", mkol, styleOwnScale|styleArea|styleNoLabel|styleNoTitle, 0, -5);

shape = Buy * shapeUpArrow + Sell* shapeDownArrow;
if (ShowArrows) PlotShapes( shape, IIf( Buy, colorGreen, colorRed ), 0, IIf( Buy, Low-f, High+f));
_SECTION_END();
3 comments
Leave Comment
Please login here to leave a comment.
When you plot Linear Regression with Trend on it (in order to validate the signals), it gives great results.
Thanks a lot for this formula.
thanx.
Dear Administrator,
This formula is duplicate with following
http://www.wisestocktrader.com/indicators/1116-visual-atr-stop-loss-system