Determine price at a specific RSI for Amibroker (AFL)
taifur_pavel almost 16 years ago Amibroker (AFL)
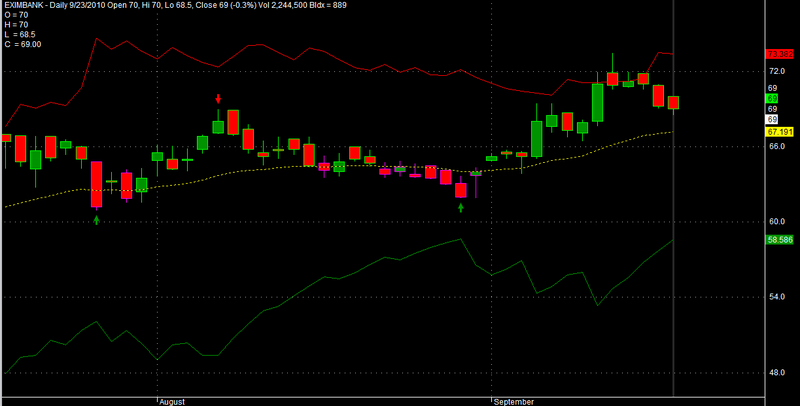
RSI Levels – appplied to Price Chart shows how far tomorrow’s closing price has to move in order for the RSI to cross the 70, 50 & 30 levels. Modified for black background and ami 5.00
Screenshots
Indicator / Formula
Copy & Paste Friendly
_SECTION_BEGIN("Determine price at a specific RSI");
// RSI Levels - appplied to Price Chart shows how far
// tomorrow's closing price has to move in order for
// the RSI to cross the 70, 50 & 30 levels.

pd = Param("Periods",13,5,144,1);
pds = 2*pd-1;//     (Adjustment for Wilders MA)
aa = Close-Ref(Close,-1);
uu = EMA(Max(0,aa),pds);
dd=  EMA((Max(0,0-aa)),pds);

rf = IIf(C>2,1000,10000);

c1 = Param("Upper Level",70,50,90,1);
qq1 =100/(100-c1)-1;
ff1 = qq1*dd-uu;
ff2 = ff1/qq1;
f1 = Max(ff1,ff2);
UL = Close + f1*(pds-1)/2;
UL = IIf(UL>C,floor(UL*rf),ceil(UL*rf))/rf;

c2 = Param("Equilibrium",50,50,50,0);
qq2 =100/(100-c2)-1;// [=1]
ff = dd-uu;
MM = Close + ff*(pds-1)/2;
MM = IIf(MM>C,floor(MM*rf),ceil(MM*rf))/rf;

c3 = Param("Lower Level",30,10,50,1);
qq3 =100/(100-c3)-1;
ff1 = qq3*dd-uu;
ff2 = ff1/qq3;
f3 = Min(ff1,ff2);
LL = Close + f3*(pds-1)/2;
LL = IIf(LL>C,floor(LL*rf),ceil(LL*rf))/rf;

Plot(UL,"",colorRed,1);
Plot(MM,"",colorYellow,32);
Plot(LL,"",colorGreen,1);

Cbr = IIf(UL<C,27,IIf(LL>C,32,IIf(MM>C,11,8)));
PlotOHLC(O,H,L,C,"",cbr,styleCandle);

Title = Name() + "  -  RSI(" + WriteVal(pd,0.0) + ")  -  Close=" +  WriteVal(Close,0.3) + "    UL=" +  WriteVal(UL,0.4) + "    MM=" +  WriteVal(MM,0.4) + "    LL=" +  WriteVal(LL,0.4);
_SECTION_END();

_SECTION_BEGIN("Price");
SetChartOptions(0,chartShowArrows|chartShowDates);
_N(Title = StrFormat("{{NAME}} - {{INTERVAL}} {{DATE}} Open %g, Hi %g, Lo %g, Close %g (%.1f%%) Vol " +WriteVal( V, 1.0 ) +" {{VALUES}}", O, H, L, C, SelectedValue( ROC( C, 1 )) ));
Plot( C, "Close", ParamColor("Color", colorWhite ), styleNoTitle | ParamStyle("Style") | GetPriceStyle() );
if( ParamToggle("Tooltip shows", "All Values|Only Prices" ) )
{
 ToolTip=StrFormat("Open: %g\nHigh:  %g\nLow:   %g\nClose:  %g (%.1f%%)\nVolume: "+NumToStr( V, 1 ), O, H, L, C, SelectedValue( ROC( C, 1 )));
}
_SECTION_END();


_SECTION_BEGIN("GIP-3");
SetChartOptions(0,chartShowArrows|chartShowDates);
_N(Title = StrFormat("{{NAME}} - {{INTERVAL}} {{DATE}} Open %g, Hi %g, Lo %g, Close %g (%.1f%%) Vol " +WriteVal( V, 1.0 ) +" {{VALUES}}", O, H, L, C, SelectedValue( ROC( C, 1 )) ));
Plot( C, "Close", ParamColor("Color", colorWhite ), styleNoTitle | ParamStyle("Style") | GetPriceStyle() );
if( ParamToggle("Tooltip shows", "All Values|Only Prices" ) )
{
 ToolTip=StrFormat("Open: %g\nHigh:  %g\nLow:   %g\nClose:  %g (%.1f%%)\nVolume: "+NumToStr( V, 1 ), O, H, L, C, SelectedValue( ROC( C, 1 )));
}

// -- what will be our lookback range for the hh and ll?
nBars = Param("Number of bars", 12, 5, 40);
bTrace = Param("Include trace output", 1, 0, 1);
nNoPivsInSetup = Param("No. Pivs in Setup", 4, 3, 4, 1);
bShowTCZ = Param("Show TCZ", 1, 0, 1);
nMinBarsBtwPivs = Param("Min. number of bars btw. pivots", 1, 1, 10, 1);
nMinPctBtwPivs = Param("Min. percent diff. btw. pivots", .05, .04, .2, .01);
bLastBarCanBePiv = Param("Last bar can be a pivot", 1, 0, 1);
retrcTolerance = .01;
tczTolerance = .005;
nNumBarsToScan = 120;

// -- added from exploration version 20040204
nExploreBarIdx = 0;
nExploreDate = 0;
nCurDateNum = 0;
DN = DateNum();
DT = DateTime();

// -- key exploration variables
bTCZLong = False;
bTCZShort = False;
nAnchorPivIdx = 0;

ADX8 = ADX(8);

// 1 - INDICATOR, 2 - COMMENTARY, 3 - SCAN,
// 4 - EXPLORATION, 5 - BACKTEST / Optimize
if(Status("action")==1) {
	bDraw = True;
	bUseLastVis = Param("Use last visible bar", 1, 0, 1);
} else {
	bDraw = False;
	bUseLastVis = False;
	bTrace = False;
	nExploreDate = Status("rangetodate");
	for (i=LastValue(BarIndex());i>=0;i--) {
		nCurDateNum = DN[i];
		if (nCurDateNum == nExploreDate) {
			nExploreBarIdx = i;
		}
	}
// -- if(Status("action")==1...
}

GraphXSpace=7;

// -- basic candle chart
// -- if this appears inside if block, strange
//    drawing results!
PlotOHLC(Open, High, Low, Close,
	"BIdx = " + BarIndex() +
	"\n" + "O = " + O + "\n"+"H = "+ H + "\n"+"L  = " + L
	+ "\n"+"C ",
	colorWhite, styleCandle);


// -- Create 0-initialized arrays the size of barcount
aHPivs = H - H;
aLPivs = L - L;
aHPivHighs = H - H;
aLPivLows = L - L;
aHPivIdxs = H - H;
aLPivIdxs = L - L;
aAddedHPivs = H - H;
aAddedLPivs = L - L;
aLegVol = H - H;
aRetrcVol = H - H;

nHPivs = 0;
nLPivs = 0;

lastHPIdx = 0;
lastLPIdx = 0;
lastHPH = 0;
lastLPL = 0;
curPivBarIdx = 0;

// -- looking back from the current bar, how many bars
//    back were the hhv and llv values of the previous
//    n bars, etc.?
aHHVBars = HHVBars(H, nBars);
aLLVBars = LLVBars(L, nBars);
aHHV = HHV(H, nBars);
aLLV = LLV(L, nBars);

// -- Initialize value of curTrend
nLastVisBar = LastValue(
	Highest(IIf(Status("barvisible"), BarIndex(), 0)));

curBar = IIf(nlastVisBar > 0 AND bUseLastVis, nlastVisBar,
	IIf(Status("action")==4 AND nExploreBarIdx > 0, nExploreBarIdx,
	LastValue(BarIndex())));

curTrend = "";
if (aLLVBars[curBar] < aHHVBars[curBar])
	curTrend = "D";
else
	curTrend = "U";

// -- Loop through bars. Search for
//    entirely array-based approach
//    in future version
/* *******************
	Find main pivots
******************* */

// -- Make sure there are enough bars!
if (curBar >= nNumBarsToScan) {
	for (i=0; i<nNumBarsToScan; i++) {

		// -- value of curBar dependent on two parameters
		curBar = IIf(nlastVisBar > 0 AND bUseLastVis,
			nlastVisBar-i,
			IIf(Status("action")==4 AND nExploreBarIdx > 0,
			nExploreBarIdx-i,
			LastValue(BarIndex())-i));

		// -- Have we identified a pivot? If trend is down...
		if (aLLVBars[curBar] < aHHVBars[curBar]) {

			// ... and had been up, this is a trend change
			if (curTrend == "U") {
				curTrend = "D";
				// -- Capture pivot information
				curPivBarIdx = curBar - aLLVBars[curBar];
				aLPivs[curPivBarIdx] = 1;
				aLPivLows[nLPivs] = L[curPivBarIdx];
				aLPivIdxs[nLPivs] = curPivBarIdx;
				nLPivs++;
			}
		// -- or current trend is up
		} else {
			if (curTrend == "D") {
				curTrend = "U";
				curPivBarIdx = curBar - aHHVBars[curBar];
				aHPivs[curPivBarIdx] = 1;
				aHPivHighs[nHPivs] = H[curPivBarIdx];
				aHPivIdxs[nHPivs] = curPivBarIdx;
				nHPivs++;
			}
		// -- 	If curTrend is up...else...
		}

	// -- loop through bars
	}
}
/* *******************
	Found main pivots
******************* */

/* *************************
	Finding missed pivot(s)
************************* */

// -- Start at last bar. Reestablish curBar
curBar =
	IIf(nlastVisBar > 0 AND bUseLastVis,
	nlastVisBar,
	IIf(Status("action")==4 AND nExploreBarIdx > 0,
	nExploreBarIdx,
	LastValue(BarIndex()))
	);

// -- Make sure I found at least two of each above.
if (nHPivs >= 2 AND nLPivs >= 2) {

	lastLPIdx = aLPivIdxs[0];
	lastLPL = aLPivLows[0];

	lastHPIdx = aHPivIdxs[0];
	lastHPH = aHPivHighs[0];

	nLastHOrLPivIdx = Max(lastLPIdx, lastHPIdx);

	nAddPivsRng = curBar - nLastHOrLPivIdx;
	aLLVAfterLastPiv = LLV(L, nAddPivsRng);
	nLLVAfterLastPiv = aLLVAfterLastPiv[curBar];
	aLLVIdxAfterLastPiv = LLVBars(L, nAddPivsRng);
	nLLVIdxAfterLastPiv = curBar - aLLVIdxAfterLastPiv[curBar];
	aHHVAfterLastPiv = HHV(H, nAddPivsRng);
	nHHVAfterLastPiv = aHHVAfterLastPiv[curBar];
	aHHVIdxAfterLastPiv = HHVBars(H, nAddPivsRng);
	nHHVIdxAfterLastPiv = curBar - aHHVIdxAfterLastPiv[curBar];

	// -- Later want to add last high pivot only if
	//    not in buy mode from last and still in trade

	/*
		Note - I'm only interested in adding pivots if I'm in
		a higher-highs or lower-lows scenario
	*/


	// -- OK, let's start where the last high pivot occurs after the
	//    last Low pivot
	if (lastHPIdx > lastLPIdx) {

		/*	There are at least two possibilities here. One is that
	   		the previous high was higher, indicating that this is a
	   		possible short retracement or one in the making.
	   		The other is that the previous high was lower, indicating
	   		that this is a possible long retracement in the working.
			However, both depend on opposing pivots. E.g., if I find
			higher highs, what if I have lower lows?

			If the highs are descending, then I can consider:
	   			- a lower low, and leave it at that
	   			- a higher high and higher low
	   			- a lower low and another lower high
		*/
		if (aHPivHighs[0] < aHPivHighs[1]) {

			if (nLLVAfterLastPiv < aLPivLows[0] AND
				(nLLVIdxAfterLastPiv - lastHPIdx - 1) >= nMinBarsBtwPivs
				AND nLLVIdxAfterLastPiv != curBar	) {

				// -- OK, we'll add this as a pivot.
				//    Mark it for plotting...
				aLPivs[nLLVIdxAfterLastPiv] = 1;
				aAddedLPivs[nLLVIdxAfterLastPiv] = 1;

				//    ...and then rearrange elements in the
				//    pivot information arrays
				for (j=0; j<nLPivs; j++) {
					aLPivLows[nLPivs-j] = aLPivLows[nLPivs-(j+1)];
					aLPivIdxs[nLPivs-j] = aLPivIdxs[nLPivs-(j+1)];
				}
				aLPivLows[0] = nLLVAfterLastPiv;
				aLPivIdxs[0] = nLLVIdxAfterLastPiv;
				nLPivs++;

			// -- Test whether to add piv given last piv is high
			//    AND we have lower highs
			}

		// -- Here, the last piv is a high piv, and we have
		//    higher-highs. The most likely addition is a
		//    Low piv that is a retracement.
		} else {

			if (nLLVAfterLastPiv > aLPivLows[0] AND
				(nLLVIdxAfterLastPiv - lastHPIdx - 1) >= nMinBarsBtwPivs
				AND nLLVIdxAfterLastPiv != curBar	) {

				// -- OK, we'll add this as a pivot.
				//    Mark it for plotting...
				aLPivs[nLLVIdxAfterLastPiv] = 1;
				aAddedLPivs[nLLVIdxAfterLastPiv] = 1;

				//    ...and then rearrange elements in the
				//    pivot information arrays
				for (j=0; j<nLPivs; j++) {
					aLPivLows[nLPivs-j] = aLPivLows[nLPivs-(j+1)];
					aLPivIdxs[nLPivs-j] = aLPivIdxs[nLPivs-(j+1)];
				}
				aLPivLows[0] = nLLVAfterLastPiv;
				aLPivIdxs[0] = nLLVIdxAfterLastPiv;
				nLPivs++;

			// -- Test whether to add piv given last piv is high
			//    AND we have lower highs
			}
		// -- The last piv is a high and we have higher highs
		//    OR lower highs
		}

	/* ****************************************************************
		Still finding missed pivot(s). Here, the last piv is a low piv.
	**************************************************************** */
	} else {

		// -- First case, lower highs
		if (aHPivHighs[0] < aHPivHighs[1]) {

			if (nHHVAfterLastPiv < aHPivHighs[0] AND
				(nHHVIdxAfterLastPiv - lastLPIdx - 1) >= nMinBarsBtwPivs
				AND nHHVIdxAfterLastPiv != curBar	) {

				// -- OK, we'll add this as a pivot.
				//    Mark that for plotting
				aHPivs[nHHVIdxAfterLastPiv] = 1;
				aAddedHPivs[nHHVIdxAfterLastPiv] = 1;

				//    ...and then rearrange elements in the
				//    pivot information arrays
				for (j=0; j<nHPivs; j++) {
					aHPivHighs[nHPivs-j] = aHPivHighs[nHPivs-(j+1)];
					aHPivIdxs[nHPivs-j] = aHPivIdxs[nhPivs-(j+1)];
				}
				aHPivHighs[0] = nHHVAfterLastPiv;
				aHPivIdxs[0] = nHHVIdxAfterLastPiv;
				nHPivs++;

			// -- Test whether to add piv given last piv is high
			//    AND we have lower highs
			}

		// -- Second case when last piv is a low piv, higher highs
		//    Most likely addition is high piv that is a retracement.
		//    Considering adding a high piv as long as it is higher
		} else {

			// -- Where I have higher highs,
			if (nHHVAfterLastPiv > aHPivHighs[0] AND
				(nHHVIdxAfterLastPiv - lastLPIdx - 1) >= nMinBarsBtwPivs
				AND nHHVIdxAfterLastPiv != curBar	) {

				// -- OK, we'll add this as a pivot.
				//    Mark it for plotting...
				aHPivs[nHHVIdxAfterLastPiv] = 1;
				aAddedHPivs[nHHVIdxAfterLastPiv] = 1;

				//    ...and then rearrange elements in the
				//    pivot information arrays
				for (j=0; j<nHPivs; j++) {
					aHPivHighs[nHPivs-j] = aHPivHighs[nHPivs-(j+1)];
					aHPivIdxs[nHPivs-j] = aHPivIdxs[nhPivs-(j+1)];
				}
				aHPivHighs[0] = nHHVAfterLastPiv;
				aHPivIdxs[0] = nHHVIdxAfterLastPiv;
				nHPivs++;

			// -- Test whether to add piv given last piv is high
			//    AND we have lower highs
			}

		}

	}

// -- If there are at least two of each
}

/* ****************************************
// -- Done with finding pivots
***************************************** */

if (bDraw) {

	// -- OK, let's plot the pivots using arrows
	PlotShapes(
		IIf(aHPivs==1, shapeDownArrow, shapeNone),
			colorRed, 0, 	High, Offset=-15);
	PlotShapes(
		IIf(aAddedHPivs==1, shapeDownArrow, shapeNone),
			colorBrown, 0, High, Offset=-15);
	PlotShapes(
		IIf(aLPivs==1, shapeUpArrow , shapeNone),
			colorGreen, 0, Low, Offset=-15);
	PlotShapes(
		IIf(aAddedLPivs==1, shapeUpArrow , shapeNone),
			colorBlue, 0, Low, Offset=-15);
}

/* ****************************************
// -- Done with discovering and plotting pivots
***************************************** */
_SECTION_END();
3 comments
Leave Comment
Please login here to leave a comment.
this formula cannot produce real results
thank you for this! works properly.
repaint code