MACD Divergences 2 for Amibroker (AFL)
filinta almost 16 years ago Amibroker (AFL)
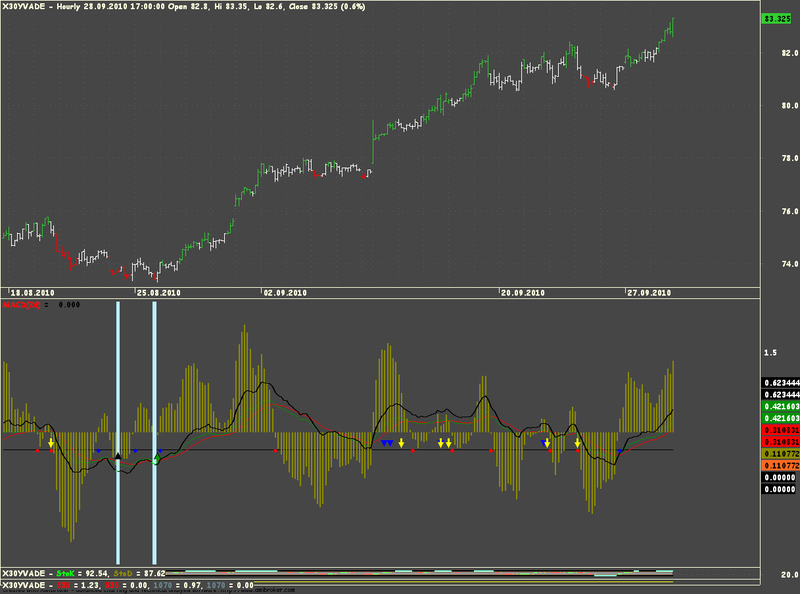
Discrepancies between price and MACD.
Screenshots
Indicator / Formula
Copy & Paste Friendly
// MACD divergence
// Backgraund color White
P = Param("Priod MACD", 26, 8, 26, 1);
VMACD = MACD(P);
Length = 100;
Lapse = 3;
fUp = VMACD > Ref(VMACD, -1) & VMACD > Ref(VMACD, 1) & VMACD >55;
fDown = VMACD < Ref(VMACD, -1) & VMACD < Ref(VMACD, 1) & VMACD < 45;
Div = 0;
for(i = Length; i < BarCount; i++)
{
// Down
if(fUp[i])
{
k = i-1;
do
{
if(VMACD[k] > VMACD[i] & fUp[i] & fUp[k])
{
if(C[k] < C[i] & i-k > Lapse)
{
Div[i] = 1;
}
k = i-Length;
}
else
k = k-1;
} while( k > i-Length );
}
////////////////////////////
// Up
if(fDown[i])
{
k = i-1;
do
{
if(VMACD[k] < VMACD[i] & fDown[i] & fDown[k])
{
if(C[k] > C[i] & i-k > Lapse)
{
Div[i] = -1;
}
k = i-Length;
}
else
k = k-1;
} while( k > i-Length );
}
}
Fon = IIf(Div == 0, 0, 1);
Col = IIf(Div == 1, 4, IIf(Div == -1, 5, 1));
Color = IIf(Div == 1, 48, IIf(Div == -1, 14, 1));
Color = IIf(fUp == 1, 48, IIf(fDown == 1, 14, 1));
Div = IIf(Div == 0, Null, abs(Div));
Fon = abs(Div);
Title = EncodeColor(4)+"MACD(" + WriteVal(P, 2.0) + ")" + EncodeColor(1) + " ="+WriteVal(MACD(P));
Plot( MACD(P), "MACD", Col, 5);
Plot( -0.015,"", 4, 16+4096);
Plot( 0.45,"", 4, 16+4096);
Plot(Fon, "", Color, 16384+32768+4096, MinValue = 0, MaxValue = 1);
_SECTION_END();
_SECTION_BEGIN("MACD Divergence");
//
// MACD divergence system
//
// This system detects MACD and MACD-H positive and negative divergences, and
// crossovers.
// This indicator/expansion is based completely on indicators/explorations written
// by other AFL contributors, all of them much cleverer than me. There is very
// little original work here.
// As an indicator, it displays the usual MACD and MACD-H indicators. It also
// displays a shape indicating where a divergence or crossover occurs.
// As an exploration, simply select n = 1, define the stock universe to be
// examined, and press the "Explore" button. The detected stocks are listed
// together with a red/green color-coded indication of the divergence or
// crossover
// Several parameters can be configured, including the minimum divergence and
// histogram widths. Configure to suit your own requirements.
// This is still a work in progress, so if you have any suggestions or improvements,
// please let me know via the forum.
//----------------------------------------------------------------------------------
//------
// Setup
//------
// Parameters
PeriodEMA = 13;
MACDIndicatorRange = 50;
// Volume filter
VolumeFilter = Param( "Volume MA filter", 100000, 50000, 500000, 100000 );
Timeframe = Interval(2);
// Adjust for weekly if necessary
if( Timeframe == "5-day" || Timeframe == "Weekly" ) {
VolumeFilter = VolumeFilter * 5;
}
else if( Timeframe == "Monthly") {
VolumeFilter = VolumeFilter * 20;
}
else if( Timeframe != "Daily" ) {
VolumeFilter = 0;
}
// Minimum number of bars required to form a divergence pattern. For a
// positive divergence, this is the number of falling bars in the context
// of a rising MACD or MACD-H pattern. Vice versa for negative divergence
MACDDivMinWidth = Param("Divergence min width", 4, 1, 10, 1 );
// Minimum width of negative projecting wave between two positive MACD-H waves,
// otherwise two positive waves will be considered as one single wave. This
// minimises invalid divergences, to ensure that "back of bears is broken".
// The same applies for a positive wave between two negative waves.
HistMinWidth = Param("Histogram min width", 4, 1, 10, 1 );
PeriodEMA = Optimize( "PeriodEMA ", 13, 5, 23, 1 );
// Other parameters
OpenPositions = 10;
ATRPeriod = 5;
InitialCapital = 100000;
PeriodFast = Param( "Fast EMA", 12, 2, 200, 1 );
PeriodSlow = Param( "Slow EMA", 26, 2, 200, 1 );
PeriodSignal = Param( "Signal EMA", 8, 2, 200, 1 );
MACDInd = MACD(PeriodFast, PeriodSlow );
SigInd = Signal(PeriodFast, PeriodSlow , PeriodSignal );
HistInd = MACDInd - SigInd ;
_N( macdStr = WriteVal( PeriodFast, 1.0 )+","+WriteVal( PeriodSlow , 1.0 ) );
_N( sigStr = macdStr + ","+WriteVal( PeriodSignal , 1.0 ) );
// Get displayed min and max value of MACD and MACD-H, to rescale it for better visibility
scMACDMax = LastValue(HHV(Max(MACDInd, sigInd),
BarsSince( Status("barvisible") AND NOT Ref(Status("barvisible"),-1) )));
scMACDMin = LastValue(LLV(Min(MACDInd, sigInd),
BarsSince( Status("barvisible") AND NOT Ref(Status("barvisible"),-1) )));
scaleMACD = Max( abs(scMACDMax), abs(scMACDMin) );
scHistMax = LastValue(HHV(HistInd,
BarsSince( Status("barvisible") AND NOT Ref(Status("barvisible"),-1) )));
scHistMin = LastValue(LLV(HistInd,
BarsSince( Status("barvisible") AND NOT Ref(Status("barvisible"),-1) )));
scaleHist = Max( abs(scHistMax), abs(scHistMin) );
Plot( HistInd, "", colorDarkYellow, styleHistogram | styleOwnScale | styleThick ,
-scaleHist * 1.2, scaleHist * 1.2);
Plot( MACDInd, "", colorGreen);
Plot( SigInd , "", colorRed);
Plot( scaleMACD * 1.2,"",colorRed,styleNoDraw);
Plot( -scaleMACD* 1.2 ,"",colorRed,styleNoDraw);
GraphXSpace = 0;
Title = EncodeColor(colorBlue) + Name() + " - MACD: M(" + macdStr + ") = "
+ WriteVal(MACDInd,1.3) + ", S(" + sigStr + ") = "
+ WriteVal(SigInd,1.3) + ", H = " + WriteVal(HistInd,1.3);
// If current symbol is NOT an index, compare volume MA to filter limit
VolumeMA = MA( V, 50 );
if( IsIndex() ) {
VolumeMABool = True;
}
else {
VolumeMABool = IsTrue( VolumeMA > VolumeFilter );
}
// Get MACD-H, EMA, Stochastics and RSI arrays
DayHist = MACD( PeriodFast, PeriodSlow ) -
Signal( PeriodFast, PeriodSlow, PeriodSignal );
DayEMA = EMA( Close, PeriodEMA );
DaySTO = StochK( 14 );
DayRSI = RSI( 14 );
DayBuyBool = IsTrue(
( // DayEMA > Ref(DayEMA,-1) // EMA rising
DaySTO < 70 // STO not overbought
// AND DayRSI > Ref(DayRSI,-1) // RSI rising
AND MACD( PeriodFast, PeriodSlow ) < 0 )
OR Timeframe == "5-day" OR Timeframe == "Weekly"
);
DaySellBool = IsTrue(
( // DayEMA < Ref(DayEMA,-1) // EMA falling
DaySTO > 30 // STO not oversold
// AND DayRSI < Ref(DayRSI,-1) // RSI falling
AND MACD( PeriodFast, PeriodSlow ) > 0 )
OR Timeframe == "5-day" OR Timeframe == "Weekly"
);
//--------------------------
// Positive MACD divergences
//--------------------------
// Get array containing for each element, when the MACD's lowest
// value occur, within the specified number of bars
MACDLowBars = LLVBars( MACDInd, MACDDivMinWidth );
// Get array defining if the MACD's previous bar was the
// minimum, AND if that MACD value < 0
MACDMinCond = MACDLowBars > 0 AND
Ref(MACDLowBars,-1) == 0 AND
Ref(MACDInd,-1) < 0;
// Get array containing MACD low bar values where lows
// occured, all other bars filled with 0
MACDLowVal = IIf( MACDMinCond , Ref(MACDInd,-1), 0 );
// Get array containing MACD low bar value at bar where MACD
// low occured, all other bars filled with preceding MACD
// low value (chandelier)
MACDLowSteps = ValueWhen( Ref(MACDMinCond,0),
Ref(MACDInd,-1), 1 );
// Get array containing price low bar values where lows
// occured, all other bars filled with huge number
PriceMACDLowVal = IIf( MACDMinCond,
Ref(LLV(L,MACDDivMinWidth ),-1),
2000000 );
// Get array containing local price low bar value at bar
// where MACD low occured, all other bars filled with preceding
// price low value (chandelier)
PriceMACDLowSteps = ValueWhen( Ref(MACDMinCond ,0),
LLV(L,MACDDivMinWidth ) );
// Get array containing differences in MACD low bar values
MACDLowDiffs = MACDLowSteps - Ref(MACDLowSteps,-1);
// Get array containing differences in price low bar values
PriceMACDLowDiffs = PriceMACDLowSteps - Ref(PriceMACDLowSteps,-1);
// Get array defining positive divergences
MACDLowBarDiffs = Ref( BarsSince(MACDMinCond ), -1 );
// Divergence signal
MACDPosDivergence = // MACDLowDiffs > 0 AND
MACDLowVal < 0
AND MACDLowVal > LLV(MACDLowVal, MACDIndicatorRange )
AND PriceMACDLowVal < LLV(Ref(PriceMACDLowVal,-1), MACDIndicatorRange )
AND PriceMACDLowDiffs < 0
AND MACDLowBarDiffs < MACDIndicatorRange
AND VolumeMABool
AND C > 1.0
// AND WeekBuyBool
;
//--------------------------
// Negative MACD divergences
//--------------------------
// Get array containing for each element, when the MACD's highest
// value occur, within the specified number of bars
MACDHighBars = HHVBars( MACDInd, MACDDivMinWidth );
// Get array defining if the MACD's previous bar was the
// maximum, AND if that MACD value > 0
MACDMaxCond = MACDHighBars > 0 AND
Ref(MACDHighBars,-1) == 0 AND
Ref(MACDInd,-1) > 0;
// Get array containing MACD high bar values where highs
// occured, all other bars filled with 0
MACDHighVal = IIf( MACDMaxCond,
Ref(MACDInd,-1), 0);
// Get array containing MACD high bar value at bar where MACD
// high occured, all other bars filled with preceding MACD
// high value (chandelier)
MACDHighSteps = ValueWhen( Ref(MACDMaxCond,0),
Ref(MACDInd,-1), 1 );
// Get array containing MACD high bar values where highs
// occured, all other bars filled with 0
PriceMACDHighVal = IIf( MACDMaxCond,
Ref(HHV(H,MACDDivMinWidth),-1),
0);
// Get array containing local price high bar value at bar
// where MACD high occured, all other bars filled with preceeding
// price high value (chandelier)
PriceMACDHighSteps = ValueWhen( Ref(MACDMaxCond,0),
HHV(H,MACDDivMinWidth) );
// Get array containing differences in MACD high bar values
MACDHighDiffs = MACDHighSteps - Ref(MACDHighSteps,-1);
// Get array containing differences in price high bar values
PriceMACDHighDiffs = PriceMACDHighSteps - Ref(PriceMACDHighSteps,-1);
// Get array defining negative divergences
MACDHighBarDiffs = Ref( BarsSince(MACDMaxCond), -1 );
// Divergence signal
MACDNegDivergence = // MACDHighDiffs < 0 AND
MACDHighVal > 0
AND PriceMACDHighVal > HHV( Ref(PriceMACDHighVal,-1), MACDIndicatorRange )
AND MACDHighVal < HHV( MACDHighVal, MACDIndicatorRange )
AND PriceMACDHighDiffs > 0
AND MACDHighBarDiffs < MACDIndicatorRange
AND VolumeMABool
AND C > 1.0
// AND WeekBuyBool
;
//------------------------------------
// Positive MACD Histogram divergences
//------------------------------------
// Get array containing when positive and negative and positive
// crossovers occured
HistPosCrossover = Cross( HistInd, 0 ) ;
HistNegCrossover = Cross( 0, HistInd ) ;
BarsSinceNegCross = BarsSince( HistNegCrossover );
BarsSincePosCross = BarsSince( HistPosCrossover );
// Get arrays containing for each element, when the MACD-H lowest
// values occur, within the specified number of bars
HistLowBars = LLVBars( HistInd, MACDDivMinWidth );
// Get array defining if the MACD-H previous bar was the minimum
// AND if that MACD-H value was < 0 or > 0
HistMinCond = HistLowBars > 0 AND
BarsSinceNegCross >= HistLowBars AND
Ref(HistLowBars,-1) == 0 AND
Ref(HistInd,-1) < 0;
// Get array containing MACD-H low bar values where lows
// occured, all other bars filled with 0
HistLowVal = IIf( HistMinCond , Ref(HistInd,-1), 0 );
// Get array containing MACD-H low bar value at bar where MACD-H
// low occured, all other bars filled with preceding MACD-H
// low value (chandelier)
HistLowSteps = ValueWhen( Ref(HistMinCond,0), Ref(HistInd,-1), 1 );
// Get array containing differences between MACD-H low bar value and the value
// at previous MACD-H zero positive crossing
// HistLowDiffs = HistLowSteps - ValueWhen( HistPosCrossover, HistLowSteps, 1 );
HistLowDiffs = HistLowSteps - Ref(HistLowSteps,-1);
// Get array containing MACD-H min value when MACD-H < 0, all other
// bars filled with 0
BarsSincePrevNegCross = ValueWhen( HistNegCrossover,
Ref(BarsSinceNegCross ,-1), 1 );
BarsSinceWideNegCross = IIf( HistInd < 0 AND
BarsSincePosCross - BarsSinceNegCross <
HistMinWidth,
BarsSincePrevNegCross + BarsSinceNegCross + 1,
BarsSinceNegCross );
HistMinSteps = IIf( !BarsSinceWideNegCross,
HistInd,
LLV( HistInd , BarsSinceWideNegCross + 1) );
// Get array containing differences in MACD-H max bar values
HistMinDiffs = IIf( HistInd < 0,
HistMinSteps - Ref(HistMinSteps,-1),
0);
// Get minumum from previous MACD-H negative wave
// Plot( ValueWhen( HistNegCrossover, Ref(HistMinSteps,-1), 1 ),"PrevHistMinSteps-1", colorGreen );
// Plot( ValueWhen( HistNegCrossover, Ref(HistMinSteps,-1), 2 ),"PrevHistMinSteps-1", colorGreen );
PrevHistMinSteps = IIf( HistInd < 0 AND
BarsSincePosCross - BarsSinceNegCross <
HistMinWidth,
ValueWhen( HistNegCrossover,
Ref(HistMinSteps,-1), 2 ),
ValueWhen( HistNegCrossover,
Ref(HistMinSteps,-1), 1 ) );
// Get array containing price low bar values where lows
// occured, all other bars filled with huge number
PriceHistLowVal = IIf( HistMinCond,
Ref(LLV(L,MACDDivMinWidth),-1),
2000000 );
// Get array containing local price low bar value at bar
// where MACD-H low occured, all other bars filled with preceding
// price low value (chandelier)
PriceHistLowSteps = ValueWhen( Ref(HistMinCond ,0),
LLV(L,MACDDivMinWidth) );
// Get array containing differences in price low bar values
PriceHistLowDiffs = PriceHistLowSteps - Ref(PriceHistLowSteps,-1);
// Get array containing price low minimum value when MACD-H < 0,
// all other bars filled with 0
PriceHistMinSteps = IIf( !BarsSinceNegCross,
L,
LLV( L , BarsSinceNegCross) );
// Get minimum from previous MACD-H negative wave
PrevPriceHistMinSteps = IIf( BarsSincePosCross - BarsSinceNegCross <
HistMinWidth,
ValueWhen( HistNegCrossover,
Ref(PriceHistMinSteps,-1), 2 ),
ValueWhen( HistNegCrossover,
Ref(PriceHistMinSteps,-1), 1 ) );
// Divergence signal
HistPosDivergence = // HistLowDiffs > 0 AND
// AND PriceHistLowDiffs < 0
HistMinSteps > PrevHistMinSteps
AND PriceHistMinSteps < PrevPriceHistMinSteps
AND HistLowVal < 0
AND VolumeMABool
AND C > 1.0
;
//------------------------------------
// Negative MACD Histogram divergences
//------------------------------------
// Get arrays containing for each element, when the MACD-H highest values
// occur, within the specified number of bars
HistHighBars = HHVBars( HistInd, MACDDivMinWidth );
// Get array defining if the MACD-H previous bar was the maximum,
// AND if that MACD-H value was < 0 OR > 0
HistMaxCond = HistHighBars > 0
AND BarsSincePosCross >= HistHighBars
AND Ref(HistHighBars,-1) == 0
AND Ref(HistInd,-1) > 0
;
// Get array containing MACD-H high bar values where highs
// occured, all other bars filled with 0
HistHighVal = IIf( HistMaxCond, Ref(HistInd,-1), 0);
// Get array containing MACD-H high bar value at bar where MACD-H
// high occured, all other bars filled with preceding MACD-H
// high value (chandelier)
HistHighSteps = ValueWhen( Ref(HistMaxCond,0),
Ref(HistInd,-1), 1 );
// Get array containing differences in MACD-H high bar values
HistHighDiffs = HistHighSteps - Ref(HistHighSteps,-1);
// Get array containing MACD-H max value when MACD-H > 0, all other
// bars filled with 0
BarsSincePrevPosCross = ValueWhen( HistPosCrossover,
Ref(BarsSincePosCross ,-1), 1 );
BarsSincePrevNegCross = ValueWhen( HistNegCrossover,
Ref(BarsSinceNegCross ,-1), 1 );
BarsSinceWidePosCross = IIf( HistInd > 0 AND
BarsSinceNegCross - BarsSincePosCross <
HistMinWidth,
BarsSincePrevPosCross + BarsSincePosCross + 1,
BarsSincePosCross );
HistMaxSteps = IIf( !BarsSinceWidePosCross,
HistInd,
HHV( HistInd , BarsSinceWidePosCross + 1) );
// Get array containing differences in MACD-H max bar values
HistMaxDiffs = IIf( HistInd > 0,
HistMaxSteps - Ref(HistMaxSteps,-1),
0);
// Get high from pevious MACD-H positive wave
PrevHistMaxSteps = IIf( HistInd > 0 AND
BarsSinceNegCross - BarsSincePosCross <
HistMinWidth,
ValueWhen( HistPosCrossover,
Ref(HistMaxSteps,-1), 2 ),
ValueWhen( HistPosCrossover,
Ref(HistMaxSteps,-1), 1 ) );
// Get array containing MACD-H high bar values where highs
// occured, all other bars filled with 0
PriceHistHighVal = IIf( HistMaxCond,
Ref(HHV(H,MACDDivMinWidth),-1),
0);
// Get array containing local price high bar value at bar
// where MACD-H high occured, all other bars filled with preceeding
// price high value (chandelier)
PriceHistHighSteps = ValueWhen( Ref(HistMaxCond,0),
HHV(H,MACDDivMinWidth) );
// Get array containing differences in price high bar values
PriceHistHighDiffs = PriceHistHighSteps - Ref(PriceHistHighSteps,-1);
// Get array containing MACD-H max value when MACD-H > 0, all other
// bars filled with 0
PriceHistMaxSteps = IIf( !BarsSincePosCross,
H,
HHV( H , BarsSincePosCross) );
// Get high from pevious MACD-H positive wave
PrevPriceHistMaxSteps = IIf( BarsSinceNegCross - BarsSincePosCross <
HistMinWidth,
ValueWhen( HistPosCrossover,
Ref(PriceHistMaxSteps,-1), 2 ),
ValueWhen( HistPosCrossover,
Ref(PriceHistMaxSteps,-1), 1 ) );
// Divergence signal
HistNegDivergence = // HistHighDiffs < 0 AND
// AND PriceHistHighDiffs > 0
HistMaxSteps < PrevHistMaxSteps
AND PriceHistMaxSteps > PrevPriceHistMaxSteps
AND HistHighVal > 0
AND VolumeMABool
AND C > 1.0
;
//-----------------------
// MACD crossover signals
//-----------------------
PosCrossover = Cross( DayHist, 0 )
AND DayBuyBool
AND VolumeMABool
AND C > 1.0
;
NegCrossover = Cross( 0, DayHist )
AND DaySellBool
AND VolumeMABool
AND C > 1.0
;
// Plot signals
PlotShapes( IIf( HistPosDivergence , shapeSmallUpTriangle, shapeNone ),
colorBlack, 0, 0 , -12 );
PlotShapes( IIf( HistNegDivergence , shapeSmallDownTriangle, shapeNone ),
colorBlue, 0, 0, -12 );
PlotShapes( IIf( MACDPosDivergence , shapeUpArrow , shapeNone ),
colorGreen, 0, Graph1, -12 );
PlotShapes( IIf( MACDNegDivergence , shapeDownArrow, shapeNone ),
colorYellow, 0, Graph1, -12 );
PlotShapes( IIf( PosCrossover , shapeSmallCircle, shapeNone ),
colorBlue, 0, Graph1 , 0 );
PlotShapes( IIf( NegCrossover , shapeSmallCircle, shapeNone ),
colorRed, 0, Graph1 , 0 );
Filter = HistPosDivergence
OR HistNegDivergence
OR PosCrossover
OR NegCrossover
OR MACDPosDivergence
OR MACDNegDivergence
;
if( Sector = SectorID( 0 ) >= 0 )
{
Sector = SectorID( 1 );
Industry = IndustryID( 1 );
}
else
{
Sector = "MG";
Industry = "MG";
}
AddColumn( 32, "H-PD", formatChar, colorDefault,
IIf(Filter && HistPosDivergence,colorBrightGreen,colorDefault) );
AddColumn( 32, "M-PD", formatChar, colorDefault,
IIf(Filter && MACDPosDivergence,colorBrightGreen,colorDefault) );
AddColumn( 32, "M-PC", formatChar, colorDefault,
IIf(Filter && PosCrossover,colorBrightGreen,colorDefault) );
AddColumn( 32, "H-ND", formatChar, colorDefault,
IIf(Filter && HistNegDivergence,colorRed,colorDefault) );
AddColumn( 32, "M-ND", formatChar, colorDefault,
IIf(Filter && MACDNegDivergence,colorRed,colorDefault) );
AddColumn( 32, "M-NC", formatChar, colorDefault,
IIf(Filter && NegCrossover,colorRed,colorDefault) );
AddTextColumn( Sector , "Sector" );
AddTextColumn( Industry , "Industry" );
_SECTION_END();
_SECTION_END();
_SECTION_END();
// MACD divergence
// Backgraund color White
P = Param("Priod MACD", 26, 8, 26, 1);
VMACD = MACD(P);
Length = 100;
Lapse = 3;
fUp = VMACD > Ref(VMACD, -1) & VMACD > Ref(VMACD, 1) & VMACD >55;
fDown = VMACD < Ref(VMACD, -1) & VMACD < Ref(VMACD, 1) & VMACD < 45;
Div = 0;
for(i = Length; i < BarCount; i++)
{
// Down
if(fUp[i])
{
k = i-1;
do
{
if(VMACD[k] > VMACD[i] & fUp[i] & fUp[k])
{
if(C[k] < C[i] & i-k > Lapse)
{
Div[i] = 1;
}
k = i-Length;
}
else
k = k-1;
} while( k > i-Length );
}
////////////////////////////
// Up
if(fDown[i])
{
k = i-1;
do
{
if(VMACD[k] < VMACD[i] & fDown[i] & fDown[k])
{
if(C[k] > C[i] & i-k > Lapse)
{
Div[i] = -1;
}
k = i-Length;
}
else
k = k-1;
} while( k > i-Length );
}
}
Fon = IIf(Div == 0, 0, 1);
Col = IIf(Div == 1, 4, IIf(Div == -1, 5, 1));
Color = IIf(Div == 1, 48, IIf(Div == -1, 14, 1));
Color = IIf(fUp == 1, 48, IIf(fDown == 1, 14, 1));
Div = IIf(Div == 0, Null, abs(Div));
Fon = abs(Div);
Title = EncodeColor(4)+"MACD(" + WriteVal(P, 2.0) + ")" + EncodeColor(1) + " ="+WriteVal(MACD(P));
Plot( MACD(P), "MACD", Col, 5);
Plot( -0.015,"", 4, 16+4096);
Plot( 0.45,"", 4, 16+4096);
Plot(Fon, "", Color, 16384+32768+4096, MinValue = 0, MaxValue = 1);
_SECTION_END();
_SECTION_BEGIN("MACD Divergence");
//
// MACD divergence system
//
// This system detects MACD and MACD-H positive and negative divergences, and
// crossovers.
// This indicator/expansion is based completely on indicators/explorations written
// by other AFL contributors, all of them much cleverer than me. There is very
// little original work here.
// As an indicator, it displays the usual MACD and MACD-H indicators. It also
// displays a shape indicating where a divergence or crossover occurs.
// As an exploration, simply select n = 1, define the stock universe to be
// examined, and press the "Explore" button. The detected stocks are listed
// together with a red/green color-coded indication of the divergence or
// crossover
// Several parameters can be configured, including the minimum divergence and
// histogram widths. Configure to suit your own requirements.
// This is still a work in progress, so if you have any suggestions or improvements,
// please let me know via the forum.
//----------------------------------------------------------------------------------
//------
// Setup
//------
// Parameters
PeriodEMA = 13;
MACDIndicatorRange = 50;
// Volume filter
VolumeFilter = Param( "Volume MA filter", 100000, 50000, 500000, 100000 );
Timeframe = Interval(2);
// Adjust for weekly if necessary
if( Timeframe == "5-day" || Timeframe == "Weekly" ) {
VolumeFilter = VolumeFilter * 5;
}
else if( Timeframe == "Monthly") {
VolumeFilter = VolumeFilter * 20;
}
else if( Timeframe != "Daily" ) {
VolumeFilter = 0;
}
// Minimum number of bars required to form a divergence pattern. For a
// positive divergence, this is the number of falling bars in the context
// of a rising MACD or MACD-H pattern. Vice versa for negative divergence
MACDDivMinWidth = Param("Divergence min width", 4, 1, 10, 1 );
// Minimum width of negative projecting wave between two positive MACD-H waves,
// otherwise two positive waves will be considered as one single wave. This
// minimises invalid divergences, to ensure that "back of bears is broken".
// The same applies for a positive wave between two negative waves.
HistMinWidth = Param("Histogram min width", 4, 1, 10, 1 );
PeriodEMA = Optimize( "PeriodEMA ", 13, 5, 23, 1 );
// Other parameters
OpenPositions = 10;
ATRPeriod = 5;
InitialCapital = 100000;
PeriodFast = Param( "Fast EMA", 12, 2, 200, 1 );
PeriodSlow = Param( "Slow EMA", 26, 2, 200, 1 );
PeriodSignal = Param( "Signal EMA", 8, 2, 200, 1 );
MACDInd = MACD(PeriodFast, PeriodSlow );
SigInd = Signal(PeriodFast, PeriodSlow , PeriodSignal );
HistInd = MACDInd - SigInd ;
_N( macdStr = WriteVal( PeriodFast, 1.0 )+","+WriteVal( PeriodSlow , 1.0 ) );
_N( sigStr = macdStr + ","+WriteVal( PeriodSignal , 1.0 ) );
// Get displayed min and max value of MACD and MACD-H, to rescale it for better visibility
scMACDMax = LastValue(HHV(Max(MACDInd, sigInd),
BarsSince( Status("barvisible") AND NOT Ref(Status("barvisible"),-1) )));
scMACDMin = LastValue(LLV(Min(MACDInd, sigInd),
BarsSince( Status("barvisible") AND NOT Ref(Status("barvisible"),-1) )));
scaleMACD = Max( abs(scMACDMax), abs(scMACDMin) );
scHistMax = LastValue(HHV(HistInd,
BarsSince( Status("barvisible") AND NOT Ref(Status("barvisible"),-1) )));
scHistMin = LastValue(LLV(HistInd,
BarsSince( Status("barvisible") AND NOT Ref(Status("barvisible"),-1) )));
scaleHist = Max( abs(scHistMax), abs(scHistMin) );
Plot( HistInd, "", colorOrange, styleHistogram | styleOwnScale | styleThick ,
-scaleHist * 1.2, scaleHist * 1.2);
Plot( MACDInd, "", colorGreen);
Plot( SigInd , "", colorRed);
Plot( scaleMACD * 1.2,"",colorRed,styleNoDraw);
Plot( -scaleMACD* 1.2 ,"",colorRed,styleNoDraw);
GraphXSpace = 0;
Title = EncodeColor(colorBlue) + Name() + " - MACD: M(" + macdStr + ") = "
+ WriteVal(MACDInd,1.3) + ", S(" + sigStr + ") = "
+ WriteVal(SigInd,1.3) + ", H = " + WriteVal(HistInd,1.3);
// If current symbol is NOT an index, compare volume MA to filter limit
VolumeMA = MA( V, 50 );
if( IsIndex() ) {
VolumeMABool = True;
}
else {
VolumeMABool = IsTrue( VolumeMA > VolumeFilter );
}
// Get MACD-H, EMA, Stochastics and RSI arrays
DayHist = MACD( PeriodFast, PeriodSlow ) -
Signal( PeriodFast, PeriodSlow, PeriodSignal );
DayEMA = EMA( Close, PeriodEMA );
DaySTO = StochK( 14 );
DayRSI = RSI( 14 );
DayBuyBool = IsTrue(
( // DayEMA > Ref(DayEMA,-1) // EMA rising
DaySTO < 70 // STO not overbought
// AND DayRSI > Ref(DayRSI,-1) // RSI rising
AND MACD( PeriodFast, PeriodSlow ) < 0 )
OR Timeframe == "5-day" OR Timeframe == "Weekly"
);
DaySellBool = IsTrue(
( // DayEMA < Ref(DayEMA,-1) // EMA falling
DaySTO > 30 // STO not oversold
// AND DayRSI < Ref(DayRSI,-1) // RSI falling
AND MACD( PeriodFast, PeriodSlow ) > 0 )
OR Timeframe == "5-day" OR Timeframe == "Weekly"
);
//--------------------------
// Positive MACD divergences
//--------------------------
// Get array containing for each element, when the MACD's lowest
// value occur, within the specified number of bars
MACDLowBars = LLVBars( MACDInd, MACDDivMinWidth );
// Get array defining if the MACD's previous bar was the
// minimum, AND if that MACD value < 0
MACDMinCond = MACDLowBars > 0 AND
Ref(MACDLowBars,-1) == 0 AND
Ref(MACDInd,-1) < 0;
// Get array containing MACD low bar values where lows
// occured, all other bars filled with 0
MACDLowVal = IIf( MACDMinCond , Ref(MACDInd,-1), 0 );
// Get array containing MACD low bar value at bar where MACD
// low occured, all other bars filled with preceding MACD
// low value (chandelier)
MACDLowSteps = ValueWhen( Ref(MACDMinCond,0),
Ref(MACDInd,-1), 1 );
// Get array containing price low bar values where lows
// occured, all other bars filled with huge number
PriceMACDLowVal = IIf( MACDMinCond,
Ref(LLV(L,MACDDivMinWidth ),-1),
2000000 );
// Get array containing local price low bar value at bar
// where MACD low occured, all other bars filled with preceding
// price low value (chandelier)
PriceMACDLowSteps = ValueWhen( Ref(MACDMinCond ,0),
LLV(L,MACDDivMinWidth ) );
// Get array containing differences in MACD low bar values
MACDLowDiffs = MACDLowSteps - Ref(MACDLowSteps,-1);
// Get array containing differences in price low bar values
PriceMACDLowDiffs = PriceMACDLowSteps - Ref(PriceMACDLowSteps,-1);
// Get array defining positive divergences
MACDLowBarDiffs = Ref( BarsSince(MACDMinCond ), -1 );
// Divergence signal
MACDPosDivergence = // MACDLowDiffs > 0 AND
MACDLowVal < 0
AND MACDLowVal > LLV(MACDLowVal, MACDIndicatorRange )
AND PriceMACDLowVal < LLV(Ref(PriceMACDLowVal,-1), MACDIndicatorRange )
AND PriceMACDLowDiffs < 0
AND MACDLowBarDiffs < MACDIndicatorRange
AND VolumeMABool
AND C > 1.0
// AND WeekBuyBool
;
//--------------------------
// Negative MACD divergences
//--------------------------
// Get array containing for each element, when the MACD's highest
// value occur, within the specified number of bars
MACDHighBars = HHVBars( MACDInd, MACDDivMinWidth );
// Get array defining if the MACD's previous bar was the
// maximum, AND if that MACD value > 0
MACDMaxCond = MACDHighBars > 0 AND
Ref(MACDHighBars,-1) == 0 AND
Ref(MACDInd,-1) > 0;
// Get array containing MACD high bar values where highs
// occured, all other bars filled with 0
MACDHighVal = IIf( MACDMaxCond,
Ref(MACDInd,-1), 0);
// Get array containing MACD high bar value at bar where MACD
// high occured, all other bars filled with preceding MACD
// high value (chandelier)
MACDHighSteps = ValueWhen( Ref(MACDMaxCond,0),
Ref(MACDInd,-1), 1 );
// Get array containing MACD high bar values where highs
// occured, all other bars filled with 0
PriceMACDHighVal = IIf( MACDMaxCond,
Ref(HHV(H,MACDDivMinWidth),-1),
0);
// Get array containing local price high bar value at bar
// where MACD high occured, all other bars filled with preceeding
// price high value (chandelier)
PriceMACDHighSteps = ValueWhen( Ref(MACDMaxCond,0),
HHV(H,MACDDivMinWidth) );
// Get array containing differences in MACD high bar values
MACDHighDiffs = MACDHighSteps - Ref(MACDHighSteps,-1);
// Get array containing differences in price high bar values
PriceMACDHighDiffs = PriceMACDHighSteps - Ref(PriceMACDHighSteps,-1);
// Get array defining negative divergences
MACDHighBarDiffs = Ref( BarsSince(MACDMaxCond), -1 );
// Divergence signal
MACDNegDivergence = // MACDHighDiffs < 0 AND
MACDHighVal > 0
AND PriceMACDHighVal > HHV( Ref(PriceMACDHighVal,-1), MACDIndicatorRange )
AND MACDHighVal < HHV( MACDHighVal, MACDIndicatorRange )
AND PriceMACDHighDiffs > 0
AND MACDHighBarDiffs < MACDIndicatorRange
AND VolumeMABool
AND C > 1.0
// AND WeekBuyBool
;
//------------------------------------
// Positive MACD Histogram divergences
//------------------------------------
// Get array containing when positive and negative and positive
// crossovers occured
HistPosCrossover = Cross( HistInd, 0 ) ;
HistNegCrossover = Cross( 0, HistInd ) ;
BarsSinceNegCross = BarsSince( HistNegCrossover );
BarsSincePosCross = BarsSince( HistPosCrossover );
// Get arrays containing for each element, when the MACD-H lowest
// values occur, within the specified number of bars
HistLowBars = LLVBars( HistInd, MACDDivMinWidth );
// Get array defining if the MACD-H previous bar was the minimum
// AND if that MACD-H value was < 0 or > 0
HistMinCond = HistLowBars > 0 AND
BarsSinceNegCross >= HistLowBars AND
Ref(HistLowBars,-1) == 0 AND
Ref(HistInd,-1) < 0;
// Get array containing MACD-H low bar values where lows
// occured, all other bars filled with 0
HistLowVal = IIf( HistMinCond , Ref(HistInd,-1), 0 );
// Get array containing MACD-H low bar value at bar where MACD-H
// low occured, all other bars filled with preceding MACD-H
// low value (chandelier)
HistLowSteps = ValueWhen( Ref(HistMinCond,0), Ref(HistInd,-1), 1 );
// Get array containing differences between MACD-H low bar value and the value
// at previous MACD-H zero positive crossing
// HistLowDiffs = HistLowSteps - ValueWhen( HistPosCrossover, HistLowSteps, 1 );
HistLowDiffs = HistLowSteps - Ref(HistLowSteps,-1);
// Get array containing MACD-H min value when MACD-H < 0, all other
// bars filled with 0
BarsSincePrevNegCross = ValueWhen( HistNegCrossover,
Ref(BarsSinceNegCross ,-1), 1 );
BarsSinceWideNegCross = IIf( HistInd < 0 AND
BarsSincePosCross - BarsSinceNegCross <
HistMinWidth,
BarsSincePrevNegCross + BarsSinceNegCross + 1,
BarsSinceNegCross );
HistMinSteps = IIf( !BarsSinceWideNegCross,
HistInd,
LLV( HistInd , BarsSinceWideNegCross + 1) );
// Get array containing differences in MACD-H max bar values
HistMinDiffs = IIf( HistInd < 0,
HistMinSteps - Ref(HistMinSteps,-1),
0);
// Get minumum from previous MACD-H negative wave
// Plot( ValueWhen( HistNegCrossover, Ref(HistMinSteps,-1), 1 ),"PrevHistMinSteps-1", colorGreen );
// Plot( ValueWhen( HistNegCrossover, Ref(HistMinSteps,-1), 2 ),"PrevHistMinSteps-1", colorGreen );
PrevHistMinSteps = IIf( HistInd < 0 AND
BarsSincePosCross - BarsSinceNegCross <
HistMinWidth,
ValueWhen( HistNegCrossover,
Ref(HistMinSteps,-1), 2 ),
ValueWhen( HistNegCrossover,
Ref(HistMinSteps,-1), 1 ) );
// Get array containing price low bar values where lows
// occured, all other bars filled with huge number
PriceHistLowVal = IIf( HistMinCond,
Ref(LLV(L,MACDDivMinWidth),-1),
2000000 );
// Get array containing local price low bar value at bar
// where MACD-H low occured, all other bars filled with preceding
// price low value (chandelier)
PriceHistLowSteps = ValueWhen( Ref(HistMinCond ,0),
LLV(L,MACDDivMinWidth) );
// Get array containing differences in price low bar values
PriceHistLowDiffs = PriceHistLowSteps - Ref(PriceHistLowSteps,-1);
// Get array containing price low minimum value when MACD-H < 0,
// all other bars filled with 0
PriceHistMinSteps = IIf( !BarsSinceNegCross,
L,
LLV( L , BarsSinceNegCross) );
// Get minimum from previous MACD-H negative wave
PrevPriceHistMinSteps = IIf( BarsSincePosCross - BarsSinceNegCross <
HistMinWidth,
ValueWhen( HistNegCrossover,
Ref(PriceHistMinSteps,-1), 2 ),
ValueWhen( HistNegCrossover,
Ref(PriceHistMinSteps,-1), 1 ) );
// Divergence signal
HistPosDivergence = // HistLowDiffs > 0 AND
// AND PriceHistLowDiffs < 0
HistMinSteps > PrevHistMinSteps
AND PriceHistMinSteps < PrevPriceHistMinSteps
AND HistLowVal < 0
AND VolumeMABool
AND C > 1.0
;
//------------------------------------
// Negative MACD Histogram divergences
//------------------------------------
// Get arrays containing for each element, when the MACD-H highest values
// occur, within the specified number of bars
HistHighBars = HHVBars( HistInd, MACDDivMinWidth );
// Get array defining if the MACD-H previous bar was the maximum,
// AND if that MACD-H value was < 0 OR > 0
HistMaxCond = HistHighBars > 0
AND BarsSincePosCross >= HistHighBars
AND Ref(HistHighBars,-1) == 0
AND Ref(HistInd,-1) > 0
;
// Get array containing MACD-H high bar values where highs
// occured, all other bars filled with 0
HistHighVal = IIf( HistMaxCond, Ref(HistInd,-1), 0);
// Get array containing MACD-H high bar value at bar where MACD-H
// high occured, all other bars filled with preceding MACD-H
// high value (chandelier)
HistHighSteps = ValueWhen( Ref(HistMaxCond,0),
Ref(HistInd,-1), 1 );
// Get array containing differences in MACD-H high bar values
HistHighDiffs = HistHighSteps - Ref(HistHighSteps,-1);
// Get array containing MACD-H max value when MACD-H > 0, all other
// bars filled with 0
BarsSincePrevPosCross = ValueWhen( HistPosCrossover,
Ref(BarsSincePosCross ,-1), 1 );
BarsSincePrevNegCross = ValueWhen( HistNegCrossover,
Ref(BarsSinceNegCross ,-1), 1 );
BarsSinceWidePosCross = IIf( HistInd > 0 AND
BarsSinceNegCross - BarsSincePosCross <
HistMinWidth,
BarsSincePrevPosCross + BarsSincePosCross + 1,
BarsSincePosCross );
HistMaxSteps = IIf( !BarsSinceWidePosCross,
HistInd,
HHV( HistInd , BarsSinceWidePosCross + 1) );
// Get array containing differences in MACD-H max bar values
HistMaxDiffs = IIf( HistInd > 0,
HistMaxSteps - Ref(HistMaxSteps,-1),
0);
// Get high from pevious MACD-H positive wave
PrevHistMaxSteps = IIf( HistInd > 0 AND
BarsSinceNegCross - BarsSincePosCross <
HistMinWidth,
ValueWhen( HistPosCrossover,
Ref(HistMaxSteps,-1), 2 ),
ValueWhen( HistPosCrossover,
Ref(HistMaxSteps,-1), 1 ) );
// Get array containing MACD-H high bar values where highs
// occured, all other bars filled with 0
PriceHistHighVal = IIf( HistMaxCond,
Ref(HHV(H,MACDDivMinWidth),-1),
0);
// Get array containing local price high bar value at bar
// where MACD-H high occured, all other bars filled with preceeding
// price high value (chandelier)
PriceHistHighSteps = ValueWhen( Ref(HistMaxCond,0),
HHV(H,MACDDivMinWidth) );
// Get array containing differences in price high bar values
PriceHistHighDiffs = PriceHistHighSteps - Ref(PriceHistHighSteps,-1);
// Get array containing MACD-H max value when MACD-H > 0, all other
// bars filled with 0
PriceHistMaxSteps = IIf( !BarsSincePosCross,
H,
HHV( H , BarsSincePosCross) );
// Get high from pevious MACD-H positive wave
PrevPriceHistMaxSteps = IIf( BarsSinceNegCross - BarsSincePosCross <
HistMinWidth,
ValueWhen( HistPosCrossover,
Ref(PriceHistMaxSteps,-1), 2 ),
ValueWhen( HistPosCrossover,
Ref(PriceHistMaxSteps,-1), 1 ) );
// Divergence signal
HistNegDivergence = // HistHighDiffs < 0 AND
// AND PriceHistHighDiffs > 0
HistMaxSteps < PrevHistMaxSteps
AND PriceHistMaxSteps > PrevPriceHistMaxSteps
AND HistHighVal > 0
AND VolumeMABool
AND C > 1.0
;
//-----------------------
// MACD crossover signals
//-----------------------
PosCrossover = Cross( DayHist, 0 )
AND DayBuyBool
AND VolumeMABool
AND C > 1.0
;
NegCrossover = Cross( 0, DayHist )
AND DaySellBool
AND VolumeMABool
AND C > 1.0
;
// Plot signals
PlotShapes( IIf( HistPosDivergence , shapeSmallUpTriangle, shapeNone ),
colorBlack, 0, 0 , -12 );
PlotShapes( IIf( HistNegDivergence , shapeSmallDownTriangle, shapeNone ),
colorBlue, 0, 0, -12 );
PlotShapes( IIf( MACDPosDivergence , shapeUpArrow , shapeNone ),
colorGreen, 0, Graph1, -12 );
PlotShapes( IIf( MACDNegDivergence , shapeDownArrow, shapeNone ),
colorYellow, 0, Graph1, -12 );
PlotShapes( IIf( PosCrossover , shapeSmallCircle, shapeNone ),
colorBlue, 0, Graph1 , 0 );
PlotShapes( IIf( NegCrossover , shapeSmallCircle, shapeNone ),
colorRed, 0, Graph1 , 0 );
Filter = HistPosDivergence
OR HistNegDivergence
OR PosCrossover
OR NegCrossover
OR MACDPosDivergence
OR MACDNegDivergence
;
if( Sector = SectorID( 0 ) >= 0 )
{
Sector = SectorID( 1 );
Industry = IndustryID( 1 );
}
else
{
Sector = "MG";
Industry = "MG";
}
AddColumn( 32, "H-PD", formatChar, colorDefault,
IIf(Filter && HistPosDivergence,colorBrightGreen,colorDefault) );
AddColumn( 32, "M-PD", formatChar, colorDefault,
IIf(Filter && MACDPosDivergence,colorBrightGreen,colorDefault) );
AddColumn( 32, "M-PC", formatChar, colorDefault,
IIf(Filter && PosCrossover,colorBrightGreen,colorDefault) );
AddColumn( 32, "H-ND", formatChar, colorDefault,
IIf(Filter && HistNegDivergence,colorRed,colorDefault) );
AddColumn( 32, "M-ND", formatChar, colorDefault,
IIf(Filter && MACDNegDivergence,colorRed,colorDefault) );
AddColumn( 32, "M-NC", formatChar, colorDefault,
IIf(Filter && NegCrossover,colorRed,colorDefault) );
AddTextColumn( Sector , "Sector" );
AddTextColumn( Industry , "Industry" );
_SECTION_END();
_SECTION_BEGIN("MACD UYUMSZ");
// MACD divergence
// Backgraund color White
P = Param("Priod MACD", 26, 8, 26, 1);
VMACD = MACD(P);
Length = 100;
Lapse = 3;
fUp = VMACD > Ref(VMACD, -1) & VMACD > Ref(VMACD, 1) & VMACD >55;
fDown = VMACD < Ref(VMACD, -1) & VMACD < Ref(VMACD, 1) & VMACD < 45;
Div = 0;
for(i = Length; i < BarCount; i++)
{
// Down
if(fUp[i])
{
k = i-1;
do
{
if(VMACD[k] > VMACD[i] & fUp[i] & fUp[k])
{
if(C[k] < C[i] & i-k > Lapse)
{
Div[i] = 1;
}
k = i-Length;
}
else
k = k-1;
} while( k > i-Length );
}
////////////////////////////
// Up
if(fDown[i])
{
k = i-1;
do
{
if(VMACD[k] < VMACD[i] & fDown[i] & fDown[k])
{
if(C[k] > C[i] & i-k > Lapse)
{
Div[i] = -1;
}
k = i-Length;
}
else
k = k-1;
} while( k > i-Length );
}
}
Fon = IIf(Div == 0, 0, 1);
Col = IIf(Div == 1, 4, IIf(Div == -1, 5, 1));
Color = IIf(Div == 1, 48, IIf(Div == -1, 14, 1));
Color = IIf(fUp == 1, 48, IIf(fDown == 1, 14, 1));
Div = IIf(Div == 0, Null, abs(Div));
Fon = abs(Div);
Title = EncodeColor(4)+"MACD(" + WriteVal(P, 2.0) + ")" + EncodeColor(1) + " ="+WriteVal(MACD(P));
Plot( MACD(P), "MACD", Col, 5);
Plot( -0.015,"", 4, 16+4096);
Plot( 0.45,"", 4, 16+4096);
Plot(Fon, "", Color, 16384+32768+4096, MinValue = 0, MaxValue = 1);
_SECTION_END();
_SECTION_END();
_SECTION_BEGIN("MACD UYUMSZ1");
// MACD divergence
// Backgraund color White
P = Param("Priod MACD", 26, 8, 26, 1);
VMACD = MACD(P);
Length = 100;
Lapse = 3;
fUp = VMACD > Ref(VMACD, -1) & VMACD > Ref(VMACD, 1) & VMACD >55;
fDown = VMACD < Ref(VMACD, -1) & VMACD < Ref(VMACD, 1) & VMACD < 45;
Div = 0;
for(i = Length; i < BarCount; i++)
{
// Down
if(fUp[i])
{
k = i-1;
do
{
if(VMACD[k] > VMACD[i] & fUp[i] & fUp[k])
{
if(C[k] < C[i] & i-k > Lapse)
{
Div[i] = 1;
}
k = i-Length;
}
else
k = k-1;
} while( k > i-Length );
}
////////////////////////////
// Up
if(fDown[i])
{
k = i-1;
do
{
if(VMACD[k] < VMACD[i] & fDown[i] & fDown[k])
{
if(C[k] > C[i] & i-k > Lapse)
{
Div[i] = -1;
}
k = i-Length;
}
else
k = k-1;
} while( k > i-Length );
}
}
Fon = IIf(Div == 0, 0, 1);
Col = IIf(Div == 1, 4, IIf(Div == -1, 5, 1));
Color = IIf(Div == 1, 48, IIf(Div == -1, 14, 1));
Color = IIf(fUp == 1, 48, IIf(fDown == 1, 14, 1));
Div = IIf(Div == 0, Null, abs(Div));
Fon = abs(Div);
Title = EncodeColor(4)+"MACD(" + WriteVal(P, 2.0) + ")" + EncodeColor(1) + " ="+WriteVal(MACD(P));
Plot( MACD(P), "MACD", Col, 5);
Plot( -0.015,"", 4, 16+4096);
Plot( 0.45,"", 4, 16+4096);
Plot(Fon, "", Color, 16384+32768+4096, MinValue = 0, MaxValue = 1);
_SECTION_END();
_SECTION_END();
_SECTION_BEGIN("Background");
SetChartOptions(0,chartShowArrows|chartShowDates);
SetChartBkColor(ParamColor("Outer panel",colorBlack)); // color of outer border
SetChartBkGradientFill( ParamColor("Inner panel upper",colorBlack),ParamColor("Inner panel lower",colorBlack));
tchoice=Param("Title Selection ",2,1,2,1);
//////////////////////////////////////////////////////////////////
_SECTION_BEGIN("Momentum");
function Momentum( array, period )
{
return array - Ref( array, -period );
}
Plot( Momentum( ParamField( "Field" ), Param("Period", 10, 1, 100 ) ),
_DEFAULT_NAME(), ParamColor("Color", ColorCycle ) );
_SECTION_END();4 comments
Leave Comment
Please login here to leave a comment.
Thanks,it’s very useful
getting error line577 can anyone correct
This is a great tool! Thanks for sharing! I will study the code and see what changes I can make to improve the indicator.
Somehow i got the MACD lines and the histogram showing as separate. Is there anything I need to change?