Stock Portfolio Organizer
The ultimate porfolio management solution.
WiseTrader Toolbox
#1 Selling Amibroker Plugin featuring:
Awesome Oscillator (AO) for Amibroker (AFL)
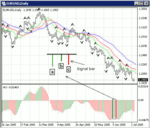
Bill Williams’ Awesome Oscillator (AO) is designed to show current market momentum and is displayed as a histogram. The Awesome Oscillator is created using the difference between the 34-period and 5-period simple moving averages of the bar’s midpoints (H+L)/2.
Each bar of the histogram that is higher than the preceding bar is green. Each bar that is lower than the preceding bar is red.
Awesome Oscillator Interpretation and Signals
Zero Line Cross
As with other oscillators such as CCI, the Awesome Oscillator generates a trading signal when the zero line is crossed. A buy signal is generated when the histogram is crossed from below. A sell signal is generated when the histogram is crossed from above.
Saucer
A buy signal is generated when the oscillator is above the zero line has two descending red bars are followed by a green bar.
A sell signal is generated when the oscillator is below the zero line and two ascending green bars are followed by a red bar.
Twin Peaks
A buy signal is created when the histogram is below the zero line and the last indicators low is higher than the preceding low. The histogram must remain below zero between these two troughs. When the higher low is made and followed by a green bar the buy signal is generated.
A sell signal is created when the histogram is above the zero line and the last bars high is lower than the preceding peak. The histogram must remain above zero line between the two peaks. When the lower high is made and followed by a red bar a sell signal is generated.
Screenshots
Similar Indicators / Formulas
Indicator / Formula
/*
   Bill William's Alligator System II Awesome Oscillator, modified from williamAlligator2.
   Reference Website:
   ==================
   http://www.alpari-idc.com/en/market-analysis-guide/chaos-theory/alligator-and-gator.html

   Original by by Steve Wiser - slwiserr@erols.com
   Modified by TohMz  on June 9th, 2008
*/
SetChartOptions( 0, chartShowArrows|chartShowDates );

_SECTION_BEGIN("BW Alligator");
/*** The trend indicators ***/

P= ParamList("Price", "Close|(H+L)/2|(H+C+L)/3",1);

if (P=="Close")
   A = C;

else
if (P=="(H+C+L)/3")
   A = (H+C+L)/3;
else
  A = (H+L)/2;

AlligatorJaw   = Ref(Wilders(A,13),-8);
AlligatorTeeth = Ref(Wilders(A,8), -5);
AlligatorLips  = Ref(Wilders(A,5), -3);

AO=MA(A,5)-MA(A,34);
AOcolor=IIf(AO>Ref(AO,-1),colorGreen,colorRed);

AC=AO-MA(AO,5);
ACcolor=IIf(AC>Ref(AC,-1),colorGreen,colorRed);

Plot(AO,"AO",AOcolor,styleHistogram|styleThick);

_SECTION_END();


_SECTION_BEGIN("BW Fractal");

UpFractal= ValueWhen(
  (Ref(H,-2) > Ref(H, -4)) AND
  (Ref(H,-2) > Ref(H, -3)) AND
  (Ref(H,-2) > Ref(H, -1)) AND
  (Ref(H,-2) > H), Ref(H,-2));

DownFractal= ValueWhen(
  (Ref(L,-2) <= Ref(L, -4)) AND
  (Ref(L,-2) <=  Ref(L, -3)) AND
  (Ref(L,-2) <=  Ref(L, -1)) AND
  (Ref(L,-2) <=  L), Ref(L,-2));


_SECTION_END();


_SECTION_BEGIN("Exploration");

/*
   Buy:  Scan stocks only breakout..maxbreakout (1~30%, default) and Trend is bullish
   Sell: Scan stocks only breakout..maxbreakout (1~30%, default) and Trend is bearish

*/
//== Price Increment Value - depend on different country
Inc = 1;


//== Set the Price Range for stock to scan
PriceFrom = Param("Price From:", 50,   1, 200000, Inc);
PriceTo   = Param("Price To:",   200000, 1, 200000, Inc);
MaxBreakOut = Param("Max Breakout (%)", 5, 1, 30);
MaxBreakOut = MaxBreakOut/100;

Buy  = C>UpFractal AND C<=(1+MaxBreakOut)*UpFractal AND AlligatorTeeth>AlligatorJaw; /* AND AlligatorLips>AlligatorTeeth; */
Sell = C<DownFractal AND C>=(1-MaxBreakOut)*DownFractal AND AlligatorTeeth<AlligatorJaw; /* AND AlligatorLips<AlligatorTeeth; */


Filter = (Buy OR Sell) AND  (MA(V,3)/EMA(V,17))>1;


AddTextColumn(FullName(), "Security", 1.0, colorDefault, colorDefault, 200);
AddTextColumn( WriteIf(Buy,"Buy", WriteIf(Sell, "Sell", "")), "Trade", 1.0);
AddColumn( UpFractal, "Up Fratal");
AddColumn( DownFractal, "Down Fratal");
AddColumn( MA(V,3)/EMA(V,17), "MAV(3/17)");
AddColumn( C, "Today's Close");

_SECTION_END();

GfxSetOverlayMode(1);
GfxSelectFont("Tahoma", Status("pxheight")/6 );
GfxSetTextAlign( 6 );// center alignment
GfxSetTextColor( ParamColor( "Warna", colorLightGrey ) );
GfxSetBkMode(0); // transparent
GfxTextOut( "Awesome", Status("pxwidth")/2, Status("pxheight")/2 );
0 comments
Leave Comment
Please login here to leave a comment.
Back