STOCHASTICS for Amibroker (AFL)
prasadbrao almost 16 years ago Amibroker (AFL)
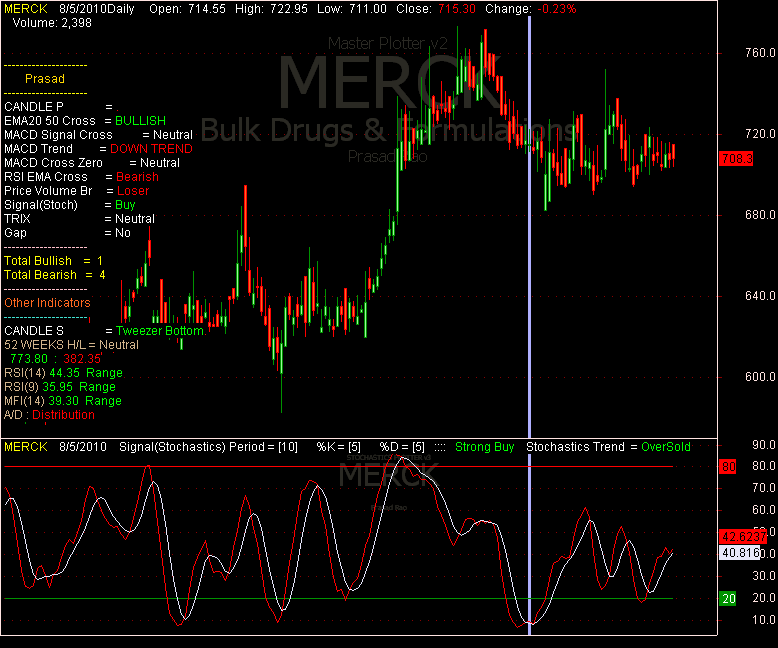
Stochastics indicator showing buy, sell, strong buy, strong sell, bullish, bearish, overbrought and oversold.
Works with Amibroker 5.2.
For lower versions delete the first 10 lines to make it work.
Screenshots
Indicator / Formula
Copy & Paste Friendly
GfxSetOverlayMode(1);
GfxSelectFont("Tahoma", Status("pxheight")/8 );
GfxSetTextAlign( 6 );// center alignment
GfxSetTextColor( ColorHSB( 42, 42, 42 ) );
GfxSetBkMode(0); // transparent
GfxTextOut( Name(), Status("pxwidth")/2, Status("pxheight")/12 );


GfxSelectFont("Tahoma", Status("pxheight")/18 );
GfxSelectFont("Tahoma", Status("pxheight")/36 );
GfxTextOut( "Prasad Rao", Status("pxwidth")/2, Status("pxheight")/3 );
GfxTextOut( "STOCHASTICS PLOTTER v3", Status("pxwidth")/2, Status("pxheight")/13 );


/*************** remove all above lines for Amibroker 5.00 or less than 5


/**************************************************
                Stochastics
***************************************************/

SP = Param( "Periods", 10, 1, 200, 1 );
Ksmooth = Param( "%K avg", 5, 1, 200, 1 );
Dsmooth = Param( "%D avg", 5, 1, 200, 1 );
StochDval = StochD( SP , Ksmooth, DSmooth );
StochKval = StochK( SP , Ksmooth);

Overbought = 80;
Oversold = 20;


Plot( StochD( SP , Ksmooth, DSmooth), _DEFAULT_NAME(), ParamColor( "ColorD", colorLavender ), ParamStyle("Style") );
Plot( StochK( SP , Ksmooth), _DEFAULT_NAME(), ParamColor( "ColorK", colorRed ), ParamStyle("Style") );

Plot(Overbought,"Overbought Level",colorRed);
Plot(Oversold,"Oversold Level",colorGreen);

StochBuy = Cross(StochK(SP,Ksmooth), StochD(SP,Ksmooth, DSmooth)) AND
(StochD(SP,Ksmooth, DSmooth) > 20) AND (StochK(SP,Ksmooth) > 20) AND
(StochD(SP,Ksmooth, DSmooth) < 80) AND (StochK(SP,Ksmooth) < 80);

StochSell = Cross (StochD(SP,Ksmooth, DSmooth), StochK(SP,Ksmooth)) AND
(StochD(SP,Ksmooth, DSmooth) > 20) AND (StochK(SP,Ksmooth) > 20) AND
(StochD(SP,Ksmooth, DSmooth) < 80) AND (StochK(SP,Ksmooth) < 80);

StochStrongBuy = Cross(StochK(SP,Ksmooth),StochD(SP,Ksmooth, DSmooth)) AND
(StochD(SP,Ksmooth, DSmooth) < 20) AND (StochK(SP,Ksmooth) < 20) ;

StochStrongSell = Cross (StochD(SP,Ksmooth,DSmooth), StochK(SP , Ksmooth));
(StochD(SP,Ksmooth, DSmooth) > 80) AND (StochK(SP,Ksmooth) > 80);

//****************** BULLISH / BEARISH *******************/
StochBull = StochK(SP , Ksmooth)>StochD(SP , Ksmooth, DSmooth) AND
(StochD(SP,Ksmooth, DSmooth) > 20) AND (StochK(SP,Ksmooth) > 20) AND
(StochD(SP,Ksmooth, DSmooth) < 80) AND (StochK(SP,Ksmooth) < 80);

StochBear = StochK(SP , Ksmooth)<StochD(SP , Ksmooth, DSmooth)AND
(StochD(SP,Ksmooth, DSmooth) > 20) AND (StochK(SP,Ksmooth) > 20) AND
(StochD(SP,Ksmooth, DSmooth) < 80) AND (StochK(SP,Ksmooth) < 80);


StochOB = (StochD(SP,Ksmooth, DSmooth) > 80) AND (StochK(SP,Ksmooth) > 80);
StochOS = (StochD(SP,Ksmooth, DSmooth) < 20) AND (StochK(SP,Ksmooth) < 20) ;

/****************************************************
                   CHART TITLES
****************************************************/


Title = EncodeColor(colorYellow)+  Title = Name() + "    " + EncodeColor(2) + Date()  + "    "


/********************STOChASTICS*********************/

+EncodeColor(colorWhite)+"Signal(Stochastics) "+EncodeColor(colorWhite)+"Period = "+"["+SP+"]"+"      %K = "+"["+Ksmooth+"]"+ "      %D = "+"["+Dsmooth+"]"+"   ::::   "

+ WriteIf(StochBuy,EncodeColor(colorBrightGreen)+"Buy",WriteIf(StochSell,EncodeColor(colorRed)+"Sell",

WriteIf(StochStrongBuy,EncodeColor(colorBrightGreen)+"Strong Buy",WriteIf(StochStrongSell,EncodeColor(colorRed)+"Strong Sell","Neutral"))))


+EncodeColor(colorWhite)+ "    " + "Stochastics Trend  = "
+WriteIf(StochBull,EncodeColor(colorBrightGreen)+"Bullish",WriteIf(StochBear,EncodeColor(colorRed)+"Bearish",
WriteIf(StochOS,EncodeColor(colorBrightGreen)+"OverSold",WriteIf(StochOB,EncodeColor(colorRed)+"OverBrought","Neutral"))));
9 comments
Leave Comment
Please login here to leave a comment.
above candle graph is not shown
i usually do not leave comments. but after using yr formula i honest wanna thank u for it. its one of the best ones i have come across. cheers mate.
hi, can u please provide the formula for MASTER PLOTTER V2. Thank you
hello MR. prasadbrao i would be grateful if u please provide the formula for the upper afl dat is master plotter v2
I am reworking on Master Plotter show in this chart.
I am still testing it.
Once I am satisfied I shall surely put it up here.
Thanks for your compliments and feed backs.
Dear Mr . Prasad Rao,
Many thanks for your post. Would it be possible for you to share us the upper AFL in this picture? I believe , this will be a great help to us. We will appriciate if you please post this afl to us.
Thanks a lot again.
Great job done…..really nice . Thanks for sharing.
good job keep it up prasdad guru
it is ok !!