Measuring Tool for Amibroker (AFL)
demon almost 16 years ago Amibroker (AFL)
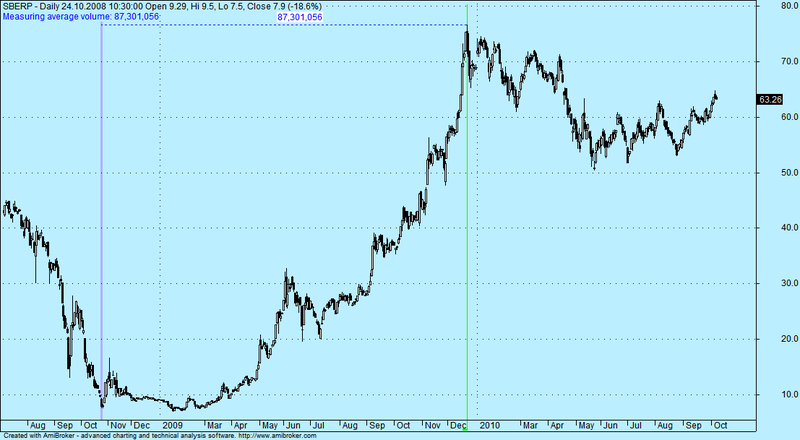
This simple tool allows measuring of a number of parameters between two points (selected as usual by vertical lines or doubleclicks). Possible cases are:
- bar count
- difference between close prices
- difference between high and low of range
- average volume
- cumulative volume
- average market facilitation index (yes, I’ve read Bill Williams’ books once :))
Seems that amibroker lacks such basic measuring capability.
New options easily could be added – just extend ParamList and append new section in switch operator.
At start I wished to select points with mouse clicks and draw a line between clicked points with a label somewhere in the middle, but I could not handle it in a such way. Maybe someone can help?
Screenshots
Indicator / Formula
Copy & Paste Friendly
_SECTION_BEGIN("Measurer");
if (ParamToggle("Enabled", "No|Yes", 1))
{
  EnableTextOutput(False);

  what = ParamList("Object", "Bar count|Price change (close)|Price change (high/low)|Average volume|Total volume|Average BW MFI", 0);
  mColor = ParamColor("Color", colorBlue);
  mStyle = ParamStyle("Style", styleLine | styleDashed, styleDashed | styleThick);
  mbgColor = ParamColor("Label Bg Color", colorWhite);
  showInTitle = ParamToggle("Show in title", "No|Yes", 1);

  SelectedBar = SelectedValue(BarIndex());
  StartRangeBar = BeginValue(BarIndex());
  FinishRangeBar = EndValue(BarIndex());

  // determine start & end of range
  if (StartRangeBar > 0 AND FinishRangeBar < BarCount - 1) // range defined by markers
  {
    start = StartRangeBar;
    end = FinishRangeBar;
  }
  else
  {
    if (StartRangeBar > 0) // range defined by start marker & selection
    {
      start = StartRangeBar;
      end = SelectedBar;
    }
    else // range defined by selected bar and end
    {
      start = SelectedBar;
      end = FinishRangeBar;
    }
  }
  if (start > end) { tmp = start; start = end; end = tmp; }

  // measuring
  switch (what)
  {
    // bar count
    case "Bar count":
      Value = end - start;
      Label = WriteVal(Value, 1.0);
      if (showInTitle) Title = "\n" + EncodeColor(mColor) + "Measuring bars: " + WriteVal(Value, 1.0);
      break;
    // price change (close)
    case "Price change (close)":
      Value = Close[end] - Close[start];
      Label = WriteVal(Value, 1.3);
      if (showInTitle) Title = "\n" + EncodeColor(mColor) + "Measuring price change (close): " + WriteVal(Value, 1.3);
      if (start != end) Plot(LineArray(start, Close[start], end, Close[end]), "", mColor, mStyle | styleNoLabel);
      break;
    // price change (high/low)
    case "Price change (high/low)":
      if (High[end] >= High[start])
        Value = High[end] - Low[start];
      else
        Value = -(High[start] - Low[end]);
      Label = WriteVal(Value, 1.3);
      if (showInTitle) Title = "\n" + EncodeColor(mColor) + "Measuring price change (high/low): " + WriteVal(Value, 1.3);
      if (start != end)
      {
        if (High[end] >= High[start])
          Plot(LineArray(start, Low[start], end, High[end]), "", mColor, mStyle | styleNoLabel);
        else
          Plot(LineArray(start, High[start], end, Low[end]), "", mColor, mStyle | styleNoLabel);
      }
      break;
    // Average volume
    case "Average volume":
      Bars = end - start + 1; // (inclusive)
      Value = 0;
      for (i = start; i <= end AND i < BarCount; i++) Value += Volume[i];
      Value = Value / Bars;
      Label = WriteVal(Value, 1.0);
      if (showInTitle) Title = "\n" + EncodeColor(mColor) + "Measuring average volume: " + WriteVal(Value, 1.0);
      break;
    // Total volume
    case "Total volume":
      Value = 0;
      for (i = start; i <= end AND i < BarCount; i++) Value += Volume[i];
      Value = Value;
      Label = WriteVal(Value, 1.0);
      if (showInTitle) Title = "\n" + EncodeColor(mColor) + "Measuring total volume: " + WriteVal(Value, 1.0);
      break;
    // Average BW MFI
    case "Average BW MFI":
      Bars = end - start + 1; // (inclusive)
      Value = 0;
      for (i = start; i <= end AND i < BarCount; i++) Value += 100000 * (High[i] - Low[i]) / Volume[i];
      Value = Value / Bars;
      fmt = 1;
      if (log10(Value) < 0) fmt += (-floor(log10(Value)) + 2) / 10;
      Label = WriteVal(Value, fmt);
      if (showInTitle) Title = "\n" + EncodeColor(mColor) + "Measuring average BW MFI: " + WriteVal(Value, fmt);
      break;
  }

  if (start != end)
  {
    // get highest visible value
    Hh = -1e8;
    for (i = Status("firstvisiblebarindex"); i < Status("lastvisiblebarindex") AND i < BarCount; i++)
    {
      if (High[i] > Hh) Hh = High[i];
    }
    VGrid = (Status("axismaxy") - Status("axisminy")) * 0.01;
    VH = Hh;
    Plot(LineArray(start, VH, end, VH), "", mColor, mStyle | styleNoLabel);
    PlotText(Label, start + (end - start) / 2 - 2, VH + VGrid, mColor, mbgColor);
  }
  EnableTextOutput(True);
}
_SECTION_END();
13 comments
Leave Comment
Please login here to leave a comment.
error coming not working check it
Whereis error? AMI 5.10.2 works fine (though if you do AFL checking it barks on “Title variable not initialized” – just ignore)
Fixed some issue with scaling.
if (start != end)
  {
    VGrid = (Status("axismaxy") - Status("axisminy")) * 0.01;
    VH = Status("axismaxy") - VGrid * 5;
    Plot(LineArray(start, VH, end, VH), "", mColor, mStyle | styleNoLabel);
    PlotText(Label, start + (end - start) / 2 - 2, VH + VGrid, mColor, mbgColor);
  }
should be replaced with
if (start != end) { // get highest visible value Hh = -1e8; for (i = Status("firstvisiblebarindex"); i < Status("lastvisiblebarindex") AND i < BarCount; i++) { if (High[i] > Hh) Hh = High[i]; } VGrid = (Status("axismaxy") - Status("axisminy")) * 0.01; VH = Hh; Plot(LineArray(start, VH, end, VH), "", mColor, mStyle | styleNoLabel); PlotText(Label, start + (end - start) / 2 - 2, VH + VGrid, mColor, mbgColor); }HI,
Admin, demon, and others,
Pl check the following small correction, it works well after that.
Gives all the values as shown in the picture ( adjust parameter ).
Thanks demon for sharing this excellent afl
CNB
// measuring
REMOVE “+” SIGN AFTER “Title” * Title += * SO AFTER THIS CORRECTION WILL LOOK LIKE Title = ++++++++++++CNB
// price change (close )REMOVE “+” SIGN AFTER “Title” * Title += * SO AFTER THIS CORRECTION WILL LOOK LIKE Title = ++++++++++++CNB
// price change (high/low)REMOVE “+” SIGN AFTER “Title” * Title += * SO AFTER THIS CORRECTION WILL LOOK LIKE Title = ++++++++++++CNB
// Average volume
REMOVE “+” SIGN AFTER “Title” * Title += * SO AFTER THIS CORRECTION WILL LOOK LIKE Title = ++++++++++++CNB
// Total volumeREMOVE “+” SIGN AFTER “Title” * Title += * SO AFTER THIS CORRECTION WILL LOOK LIKE Title = ++++++++++++CNB
// Average BW MFIREMOVE “+” SIGN AFTER “Title” * Title += * SO AFTER THIS CORRECTION WILL LOOK LIKE Title = ++++++++++++CNB
_SECTION_END();Hi cnbondre and demon
I adjusted the formula as per both comments.
GOOD one
I want to add the percentage change between two points? how can i do it ?
Kindly help
not working still
Showing the percentage change between the two points I want to mouse clicks.
Thanks demon for sharing this excellent afl.
Is it possible to show the percentage change of the trend line?
As you see this formula works by bar selection, not actual mouse clicks. Percentage change between two points defined by range can be added by new section in switch operator (just as Price change in currency).
For now I’m not able to produce such a tool that selects region with mouse clicks at arbitrary point of a chart. I’ve written that in description and if anyone could assist to explain how I can handle mouse events – this would be nice :) Or someday I’ll dig it by myself. If I’ll do this I just post here my new code. Cheers.
By the way – percentage change of a trend line could be seen in a tooltips when you using native amibroker trendlines. This tool I made to examine barcounts of swings and average volumes.
Mr. Demon, thank you for an explanation.
thanks
can someone explain, how to make it work, this is fabulous afl
Hello,
5.4 Version only show barcount, others cannot show at all.
Good thinking, But I would like to know except use mouse selection. Could I input specified two date parameters to formula show infomration?