MA Ribbon for Amibroker (AFL)
sujop over 15 years ago Amibroker (AFL)
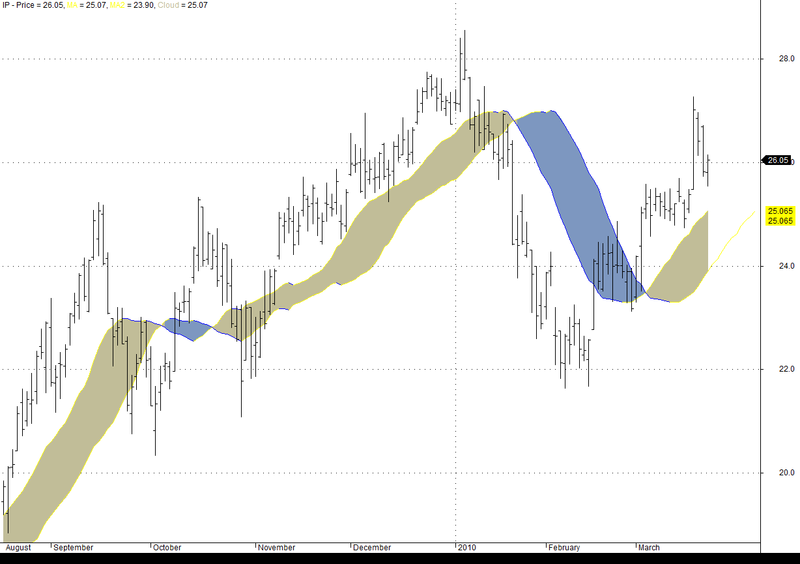
The MA Ribbon cuts through the noise to display the strength of a trend.The strength of the trend is shown via the difference between current bar’s MA and the MA of X bars ago. (usually half of the MA length). When the trend strength is positive and increasing, the indicator will display an upward ribbon that is increasing in width.When the trend strength is decreasing, the ribbon narrows.Eventually when the market reverses, the ribbon will change color,
then reverses direction.
Screenshots
Indicator / Formula
Copy & Paste Friendly
/////////////////////////////////////////////////////////////////////////////////////////////////////////////////////////

// Name : MA Ribbon
// Date   : 20100112
// Release : 1.0
// Language : AFL for AmiBroker

// Author :       TAMS
// http://www.traderslaboratory.com/forums/f46/ma-ribbon-6992.html
// Adapted from Easy Language : aaa
// Color : Head2K

// Public license
// Terms of use:
// You are required to include this header if you incorporate
// all or parts of the concepts or codes of this indicator.

// The MA Ribbon cuts through the noise to display the strength of a trend
//
// The strength of the trend is shown via the difference between current bar's MA
// and the MA of X bars ago. (usually half of the MA length)
//
// When the trend strength is positive and increasing,
// the indicator will display an upward ribbon that is increasing in width.
// When the trend strength is decreasing, the ribbon narrows.
// Eventually when the market reverses, the ribbon will change color,
// then reverses direction

// Differences with TradeStation or Multicharts
// 2) The lenght is adjustable with a slider in a floating window in Real Time
// 1) The loocback is projected in the future

Plot(C,"Price",colorBlack,styleBar);

Periods      = Param("Periods",      20, 2, 150, 1, 0 );
Displacement = Param("Displacement", 10, -150, 150 );

MAactual = MA( C, Periods );
MAdisp   = Ref( MA( C, Periods ), -Displacement);

ColorMA = MA( C , Periods ) < Ref( MA( C , Periods ), -1) ;

Plot( MA( C , Periods ), "MA",
IIf( ColorMA, ParamColor( "ColorUp.MA", colorBlue ), ParamColor( "ColorDn.MA", colorYellow ) ),
ParamStyle( "Style.MA") | styleNoRescale );

Plot( MA( Close, Periods ), "MA2",
IIf( ColorMA, ParamColor( "ColorUp.MA", colorBlue ), ParamColor( "ColorDn.MA", colorYellow ) ),
ParamStyle( "StyleMA2") | styleNoRescale , Null, Null, Displacement  );

PlotOHLC( MAdisp , MAactual, MAdisp, MAactual, "Cloud",
IIf( MAactual > MAdisp, ParamColor( "ColorCloud.Up", ColorRGB( 193 , 189 , 152 )), ParamColor( "ColorCloud.Dn", ColorRGB( 125 , 151 , 192 ))),
styleCloud | styleNoRescale | styleNoLabel );
0 comments
Leave Comment
Please login here to leave a comment.