Stock Portfolio Organizer

The ultimate porfolio management solution.

Shares, Margin, CFD's, Futures and Forex
EOD and Realtime
Dividends and Trust Distributions
And Much More ....
For Portfolio Manager Click Here

WiseTrader Toolbox

#1 Selling Amibroker Plugin featuring:

Advanced Adaptive Indicators
Advanced Pattern Exploration
Neural Networks
And Much More ....
Find Out More Here

RAJASWAMY DCAM for Amibroker (AFL)

Rating:
3 / 5 (Votes 7)
Tags:
oscillator, amibroker

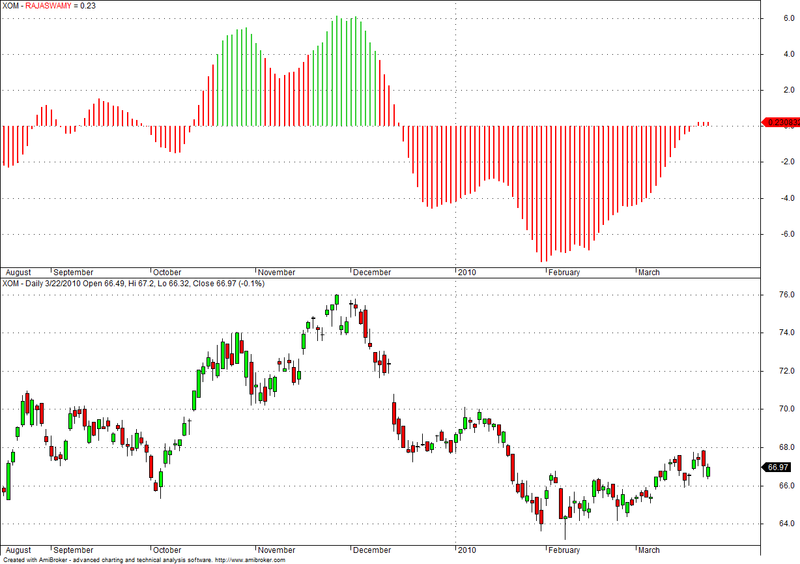
THIS INDICATOR LOOK LIKE MACD BUT IT IS MORE THEN ACCURATE AND IMPORTANT IS NO NOICE IT WONT CONFUSE THE TREND EVERY BUY SELL IT ACCURANCY IS 100% TRY AND REPLY ME

Screenshots

Similar Indicators / Formulas

3 Days Track
Submitted by janet0211 almost 14 years ago
Trading Volume Statistic
Submitted by tuanstock1 almost 10 years ago
Ergodic Oscillator
Submitted by dljtrader over 13 years ago
BoH Risk Aversion Indicator
Submitted by genkumag over 12 years ago
Chande Momentum Oscillator
Submitted by klimpek over 13 years ago
%R ++
Submitted by reb almost 14 years ago

Indicator / Formula

Copy & Paste Friendly
P1 = Param("Short Period",7, 1,100,1);
P2 = Param("Long Period",65,1,100,1);
L1=Param("Threshold",4,2,10,1);
U= MA(C,P1)-MA(C,P2);
R=100*U/MA(C,P2);
MyColor=IIf(R>L1, colorLime,colorRed);
Plot( R,"RAJASWAMY",Mycolor, 2| 4);

2 comments

1. sirifem21

i yhink the formula is not complete.
i am getting only the red lines and not the green as shown in the photo sample

2. rajibculaw

Line 6 …‘Green’ will have to b placed instead of ‘Lime’.

Leave Comment

Please login here to leave a comment.

Back