The Finite Volume Element Indicator for Amibroker (AFL)
leedat over 15 years ago Amibroker (AFL)
The Finite Volume Element Indicator (FVE)
FVE is a money flow indicator but with two important differences from existing money flow indicators:
- It resolves contradictions between intraday money flow indicators (such as Chaikin s money flow) and interday money flow indicators (like On Balance Volume) by taking into account both intra- and interday price action.
- Unlike other money flow indicators which add or subtract all volume even if the security closed just 1 cent higher than the previous close, FVE uses a volatility threshold to take into account minimal price changes.
The FVE provides 3 types of signals:
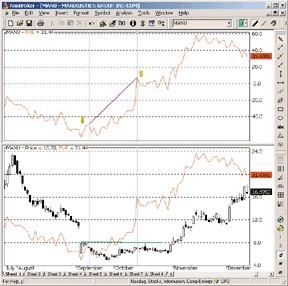
1. The strongest signal is divergence between price and the indicator. Divergence can provide leading signals of breakouts or warnings of impending corrections. The classic method for detecting divergence is for FVE to make lower highs while price makes higher highs (negative divergence). An alternative method is to draw the linear regression line on both charts, and compare the slopes. A logical buy signal would be for FVE, diverging from price, to rise sharply and make a series higher highs and/or higher lows.
2. The most obvious and coincident signal is the slope of the FVE line. An upward slope indicates that the bulls are in control and the opposite for downward.
3. This is a unique and very important property of this indicator. Values above zero are bullish and indicate accumulation while values below zero indicate distribution. FVE crossing the zero line indicates that the short to intermediate balance of power is changing from the bulls to the bears or vice versa. The best scenario is when a stock is in the process of building a base, and FVE diverges from price and rises to cross the zero line from below, at a sharp angle. Conversely the crossing of the zero line from above is a bearish signal to liquidate positions or initiate a short trade.
Screenshots
Indicator / Formula
Period = Param("FVE period", 22, 10, 80, 1 );

MF = C - (H+L)/2 + Avg - Ref( Avg, -1 );
Vc = IIf( MF > 0.003 * C, V,
IIf( MF < -0.003 * C, -V, 0 ) );
FVE = Sum( Vc, Period )/MA( V, Period )/Period * 100;

Plot( FVE, "FVE", colorLime );

GraphXSpace = 3;
Buy = Cross( FVE, -5 ) AND
LinRegSlope( FVE, 35 ) > 0 AND
LinRegSlope( Close, 35 ) < 0;
Sell = LinRegSlope( FVE, 25 ) < 0 OR Ref( Buy, -50 );
2 comments
Leave Comment
Please login here to leave a comment.
AFL NOT WORKING
OK GOOD