Cole by Marek Chlopek for Amibroker (AFL)
mamunbaf9117 over 15 years ago Amibroker (AFL)
= Cole.afl is created by Marek Chlopek in the year 2001.
= Cole trading method : Rally, Reaction, Inside, Outside and Rally with Volume, Reaction with Volume formulas.
= Cole Trading Method description:
- A up signal is formed when a stock makes three Rally Days in a row with larger volume on each day
- A down signal is formed when a stock makes three Reaction Days in a row with larger volume on each day
- Inside and Outside Days are ignored
Author: Marek Chlopek
Screenshots
Indicator / Formula
Copy & Paste Friendly
// Cole Trading Method
//
// Rally, Reaction, Inside, Outside and Rally with Volume, Reaction with
// Volume formulas
//
//------------------------------------------------------------------------------
/* COLE.AFL v 1.00 17/10/2001
/* Cole Trading Method
/* Developed by Roger Cole
/* From Technical Analysis of Stocks and Commodities, V8:12 (460-463), by Alan Friedman
/* Indicator developed and coded by Marek Chlopek, October 2001
/* Support from Tomasz Janeczko and Amibroker Mailing List members - THANKS!!! */
/* ************************************************************************** */
/* Cole Trading Method description
/* A up signal is formed when a stock makes three Rally Days in a row with larger volume on each day
/* A down signal is formed when a stock makes three Reaction Days in a row with larger volume on each day
/* Inside and Outside Days are ignored */
/* ************************************************************************** */
/* Cole Trading Method Indicator development description
/* Cole Trading Method measures two independent signals: day status (Rally, Reaction, Inside, Outside) and volume,
/* therefore two independent sub-indicators have been implemented:
/* ColeDay - counts number of days in a row when Rally (positive) or Reaction (negative)
/* ColeVolume - counts number of days with higher volume, always positive */
/* ************************************************************************** */
/* Cole's Trading Day Status definition */
RY = H > Ref(H, -1) AND L >= Ref(L, -1); // Rally Day
RX = H <= Ref(H, -1) AND L < Ref(L, -1); // Reaction Day
IN = H <= Ref(H, -1) AND L >= Ref(L, -1); // Inside Day
OUT = H > Ref(H, -1) AND L < Ref(L, -1); // Outside Day
VolRY = Ref(V, - BarsSince(RY));
VolRX = Ref(V, - BarsSince(RX));
RYwithVol = RY AND V > IIF(RY, Ref(VolRY, -1), VolRY); // Rally Day with Volume
RXwithVol = RX AND V > IIF(RX, Ref(VolRX, -1), VolRX); // Reaction Day with Volume
/* ************************************************************************** */
/* ColeDay - counts number of Rally Days in a row (positive) or Reaction Days in a row (negative)
/* When Rally ColeDay increases by 1 unless the first Rally Day then ColeDay = 1
/* When Reaction ColeDay decreases by 1 unless the first Reaction Day then ColeDay = -1
/* When Inside Day or Outside Day then ColeDay stays unchanged */
PeriodRY = BarsSince(NOT RY);
PeriodRX = BarsSince(NOT RX);
ColeDay = ValueWhen(RX or RY, Sum(RY, PeriodRY) - Sum(RX, PeriodRX));
/* ************************************************************************** */
/* ColeVolume - counts number of days with higher volume, always positive
/* When volume higher than previous day volume ColeVolume increases by 1
/* When volume lower previous day volume then ColeVolume = 1
/* When Inside Day or Outside Day then ColeVolume stays unchanged */
PeriodV = BarsSince(V < Ref(V, -1) AND (RX or RY));
ColeVolume = ValueWhen(RX or RY, Sum (RX+RY, PeriodV) +1);
/* ************************************************************************** */
/* Trading Signals in Cole Trading Method
/* Buy Signal - when a stock makes three Rally Days in a row with larger volume on each day
/* Sell Signal - when a stock makes three Reaction Days in a row with larger volume on each day */
Buy = ColeDay >= 3 AND ColeVolume >= 3;
Sell = ColeDay <= -3 AND ColeVolume >= 3;
Cover = Buy;
Short = Sell;
/* ************************************************************************** */
/* Graphic presentation in Amibroker */
maxgraph = 2;
graph0 = ColeDay;
graph1 = ColeVolume;
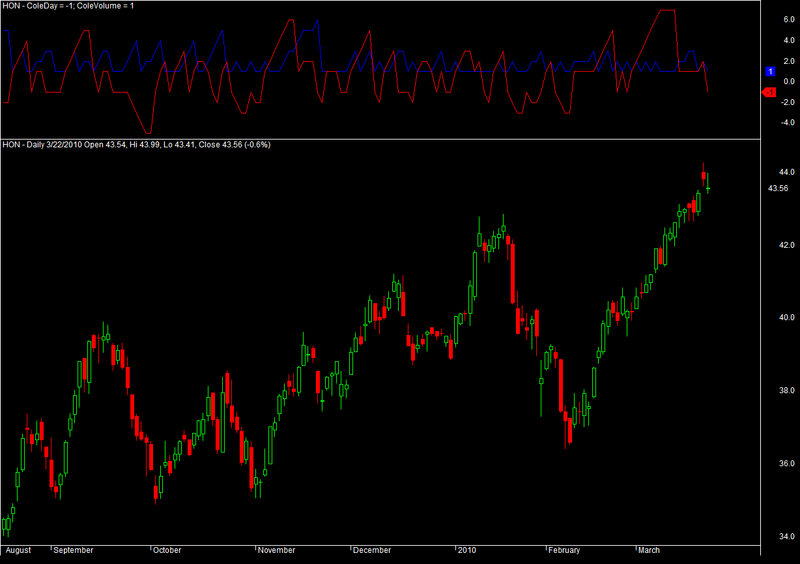
title = name() + " - ColeDay = " + WriteVal(graph0, 1.0) + "; ColeVolume = " + WriteVal(graph1, 1.0);
/* ************************************************************************** */
/* Exploration in Amibroker */
filter = 1;
numcolumns = 9;
column0 = H; column0name = "H"; column0format = 1.2;
column1 = L; column1name = "L"; column1format = 1.2;
column2 = V; column2name = "V"; column2format = 1.0;
column3 = RY; column3name = "RY"; column3format = 1.0;
column4 = RX; column4name = "RX"; column4format = 1.0;
column5 = IN; column5name = "IN"; column5format = 1.0;
column6 = OUT; column6name = "OUT"; column6format = 1.0;
column7 = ColeDay; column7name = "ColeDay"; column7format = 1.0;
column8 = ColeVolume; column8name = "ColeVolume"; column8format = 1.0;
/* ************************************************************************** */
/* END COLE Indicator Formula */
2 comments
Leave Comment
Please login here to leave a comment.
Not show red line like this picture on amibroker 6
This formula is an exploration/trading system only it doesn’t plot anything. The red line is probably another indicator.