8_Indicator_TS for Amibroker (AFL)
sfialok over 15 years ago Amibroker (AFL)
This AFL is very useful.
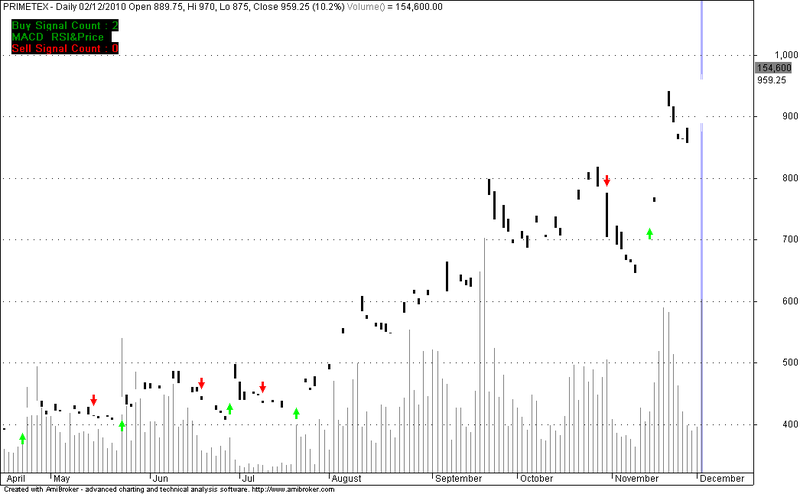
Screenshots
Indicator / Formula
Copy & Paste Friendly
_SECTION_BEGIN("Chart Display");
GraphXSpace = 10;
SetBarsRequired(1,1);

SetChartOptions(0,chartShowArrows|chartShowDates|chartWrapTitle);
Plot( C, "Close", ParamColor("Candle Outline Color?", colorWhite), styleCandle|styleNoTitle);
_N(Title = StrFormat("{{NAME}} - {{INTERVAL}} {{DATE}} Open %g, Hi %g, Lo %g, Close %g (%.1f%%) {{VALUES}}", O, H,

L, C, SelectedValue( ROC( C, 1 )) ));
_SECTION_END();

_SECTION_BEGIN("Volume");
Plot(Volume, _DEFAULT_NAME(), ParamColor("Color", colorGrey50), ParamStyle( "Style", styleHistogram | styleOwnScale,

maskHistogram), 2 );
_SECTION_END();

VBS=0;
VSS=0;
VBM = "";
VSM = "";

_SECTION_BEGIN("Parameter Settings");
ap = Param("Aroon Periods", 14, 1, 100, 1 );
ParamStr("--------------- ------------------","-");
bp = Param("Bollinger Bands Periods", 15, 2, 300, 1 );
bw = Param("Bollinger Bands Width", 2, 0, 10, 0.05 );
ParamStr("--------------------------------","-");
r1 = Param( "MACD Fast Average", 12, 2, 200, 1 );
r2 = Param( "MACD Slow Average", 26, 2, 200, 1 );
r3 = Param( "MACD Signal Average", 9, 2, 200, 1 );
ParamStr("---------------------------------","-");
mp = Param( "MFI Periods", 14, 2, 200, 1 );
ParamStr("--------------- -----------------","-");
rp = Param( "RSI Periods", 15, 1, 200, 1 );
ParamStr("---------------- -----------------","-");
P1 = Param("Fast MA Period?",3,1,100);
P2 = Param("Medium MA Period?",5,1,300);
P3 = Param("Short MA Period?",8,1,300);

HHVBS = HHVBars(H,ap+1);
LLVBS = LLVBars(L,ap+1);

Aroon_Up = ((ap-HHVBS)/ap)*100;
Aroon_Down = ((ap-LLVBS)/ap)*100;
Aroon_Buy = Aroon_Up>70 AND Aroon_Down<30;
Aroon_Sell = Aroon_Up<30 AND Aroon_Down>70;

VBS = IIf(Aroon_Buy,VBS+1,VBS);
VSS = IIf(Aroon_Sell,VSS+1,VSS);
VBM = WriteIf(Aroon_Buy,VBM + "Aroon  ",VBM);
VSM = WriteIf(Aroon_Sell,VSM + "Aroon  ",VSM);

BB_Buy = C<BBandBot(C,bp,bw);
BB_Sell = C>BBandTop(C,bp,bw);

VBS = IIf(BB_Buy,VBS+1,VBS);
VSS = IIf(BB_Sell,VSS+1,VSS);
VBM = WriteIf(BB_Buy,VBM + "Bollinger Bands  ",VBM);
VSM = WriteIf(BB_Sell,VSM + "Bollinger Bands  ",VSM);

ml = MACD(r1, r2);
sl = Signal(r1,r2,r3);
MACD_Hist = ml-sl;

MACD_Buy = ml>0 OR ml>sl;
MACD_Hist_Buy = MACD_Hist<0 AND MACD_Hist>Ref(MACD_Hist,-1);
MACD_Sell = ml<0 OR ml<sl;
MACD_Hist_Sell = MACD_Hist>0 AND MACD_Hist<Ref(MACD_Hist,-1);

VBS = IIf(MACD_Buy,VBS+1,VBS);
VSS = IIf(MACD_Sell,VSS+1,VSS);
VBS = IIf(MACD_Hist_Buy,VBS+1,VBS);
VSS = IIf(MACD_Hist_Sell,VSS+1,VSS);

VBM = WriteIf(MACD_Buy,VBM + "MACD  ",VBM);
VSM = WriteIf(MACD_Sell,VSM + "MACD  ",VSM);
VBM = WriteIf(MACD_Hist_Buy,VBM + "MACD-Histogram  ",VBM);
VSM = WriteIf(MACD_Hist_Sell,VSM + "MACD-Histogram  ",VSM);

MFI_Buy = MFI(mp)<20;
MFI_Sell = MFI(mp)>80;

VBS = IIf(MFI_Buy,VBS+1,VBS);
VSS = IIf(MFI_Sell,VSS+1,VSS);

VBM = WriteIf(MFI_Buy,VBM + "MFI  ",VBM);
VSM = WriteIf(MFI_Sell,VSM + "MFI  ",VSM);

RSI_Value = RSI(rp);
RSI_Buy = RSI_Value>30 AND Ref(RSI_Value,-1)<=30;
RSI_Sell = RSI_Value<70 AND Ref(RSI_Value,-1)>=70;

RSI_Price_Buy = RSI_Value>Ref(RSI_Value,-1) AND C>Ref(C,-1) AND RSI_Value>50;
RSI_Price_Sell = RSI_Value<Ref(RSI_Value,-1) AND C<Ref(C,-1) AND RSI_Value<50;

VBS = IIf(RSI_Buy,VBS+1,VBS);
VSS = IIf(RSI_Sell,VSS+1,VSS);

VBS = IIf(RSI_Price_Buy,VBS+1,VBS);
VSS = IIf(RSI_Price_Sell,VSS+1,VSS);

VBM = WriteIf(RSI_Buy,VBM + "RSI  ",VBM);
VSM = WriteIf(RSI_Sell,VSM + "RSI  ",VSM);
VBM = WriteIf(RSI_Price_Buy,VBM + "RSI&Price  ",VBM);
VSM = WriteIf(RSI_Price_Sell,VSM + "RSI&Price  ",VSM);

Fast_MA = MA(C,P1);
Medium_MA = MA(C,P2);
Slow_MA = MA(C,P3);

MA_Buy = Fast_MA>Medium_MA AND Medium_MA>Slow_MA;
MA_Sell = Fast_MA<Medium_MA AND Medium_MA<Slow_MA;

VBS = IIf(MA_Buy,VBS+1,VBS);
VSS = IIf(MA_Sell,VSS+1,VSS);
VBM = WriteIf(MA_Buy,VBM + "MA  ",VBM);
VSM = WriteIf(MA_Sell,VSM + "MA  ",VSM);

_SECTION_END();

_SECTION_BEGIN("Trading System");

Count = Param("Trading System based on how many parameters?",3,1,8);

Buy = VBS>=Count;
Sell = VSS>=Count;

Buy = ExRem(Buy,Sell);
Sell = ExRem(Sell,Buy);

PlotShapes(IIf(Buy,shapeUpArrow,shapeNone), colorBrightGreen, 0, L, Offset=-15);
PlotShapes(IIf(Sell,shapeDownArrow,shapeNone), colorRed, 0, H, Offset=-15);

AlertIf(Buy, "SOUND C:\\program files\\amibroker\\tada.wav", "Buy alert : "+C,1);
AlertIf(Sell, "SOUND C:\\program files\\amibroker\\notify.wav", "Sell alert : "+C,2);

MessageBg = ParamColor("Message Background Color?",colorBlack);
GfxSetBkColor(MessageBg);
GfxSelectFont("Arial",10,600);
GfxSetTextColor(colorGreen);
GfxTextOut("Buy Signal Count : "+VBS,15,25);
GfxTextOut(VBM,15,40);
GfxSetTextColor(colorRed);
GfxTextOut("Sell Signal Count : "+VSS,15,55);
GfxTextOut(VSM,15,70);

_SECTION_END();
2 comments
Leave Comment
Please login here to leave a comment.
this is zultanji AFL
Hellow My dear Friend,
This is one of the best indicator to take decision while buying/selling. One important point is :
1) You can not buy sell as per the signals. Its not much profitable & creates tension as you do not know when to book profits
2) To overcome the above, one should develop his own buy sell rules. while buying & selling, the trader must refer the this .
Its superb as per my buy/sell rules. my rating is 5
Thanks a lot & regards
viswanath