Stock Portfolio Organizer

The ultimate porfolio management solution.

Shares, Margin, CFD's, Futures and Forex
EOD and Realtime
Dividends and Trust Distributions
And Much More ....
For Portfolio Manager Click Here

WiseTrader Toolbox

#1 Selling Amibroker Plugin featuring:

Advanced Adaptive Indicators
Advanced Pattern Exploration
Neural Networks
And Much More ....
Find Out More Here

TSI for Amibroker (AFL)

Rating:
4 / 5 (Votes 2)
Tags:
oscillator, amibroker

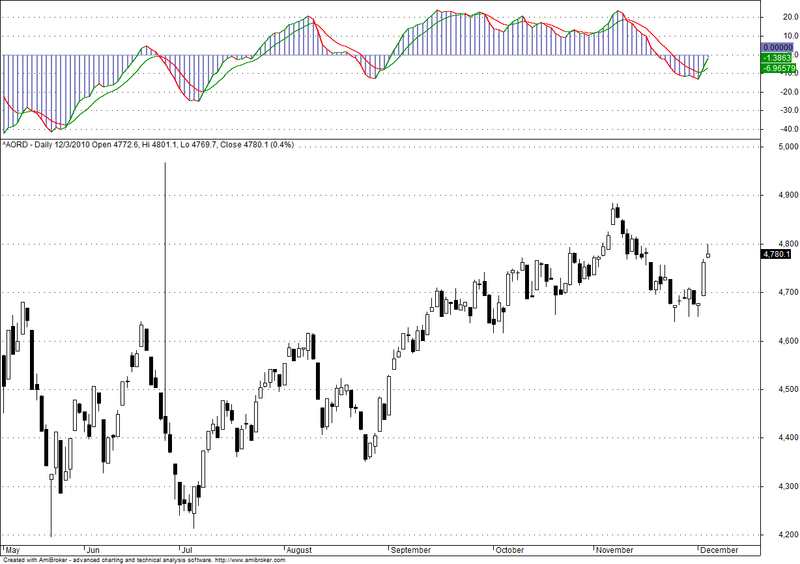
This is a tweaked TSI from William Blau, plotted in a different way.
Gives very nice signals, when both lines are crossing!

Screenshots

Similar Indicators / Formulas

3 Days Track
Submitted by janet0211 almost 14 years ago
Trading Volume Statistic
Submitted by tuanstock1 over 9 years ago
Ergodic Oscillator
Submitted by dljtrader over 13 years ago
BoH Risk Aversion Indicator
Submitted by genkumag over 12 years ago
Chande Momentum Oscillator
Submitted by klimpek over 13 years ago
%R ++
Submitted by reb almost 14 years ago

Indicator / Formula

Copy & Paste Friendly
_SECTION_BEGIN("TSI");
r = Param( "TSI period 'R':", 7, 1, 100, 1 );
s = Param( "TSI period 'S':", 27, 1, 100, 1 );
u = Param( "TSI period 'U':", 1, 1, 100, 1 );
sig = Param( "Signal period:", 7, 1, 100, 1 );
 
Mtm = C - Ref ( C, -1 );
AbsMtm = abs ( Mtm );
Num_T = EMA ( EMA( EMA ( Mtm, r ), s ), u );
Den_T = EMA ( EMA( EMA ( AbsMtm, r ), s ), u);

TSI = 100 * Nz ( Num_T / Den_T );
TSIL = 100 * Nz ( Num_T / Den_T );

//Green TSIL Line=Rising; Red TSIL Line=Falling
col = IIf( TSIL > Ref( TSIL, -1 ), colorGreen, colorRed );
Plot( TSIL, "TSI("+r+","+s+","+u+")", col, styleLine | styleThick);
//Green EMA TSI,sig Line=Rising; Red EMA TSI,sig Line=Falling
col = IIf( EMA(TSI,sig) > Ref( EMA(TSI,sig), -1 ), colorGreen, colorRed );
Plot( EMA(TSI,sig), "", col, styleThick);
Plot( TSI, "TSI("+r+","+s+","+u+")", ParamColor( "Color", colorBlueGrey ), ParamStyle("Histogram style", styleThick | styleHistogram | styleNoLabel, maskHistogram ) );
Plot(0,"ZeroLine",ParamColor( "ColorZero", colorBlueGrey ),styleLine);

Title =FullName();
_SECTION_END();

9 comments

1. baby.learn.to.trade

this param is original from William Blau

r = Param( "TSI period 'Length':", 25, 1, 100, 1 );
s = Param( "TSI period 'Smoothing':", 13, 1, 100, 1 );
2. Anonymous

Hi baby.learn.to.trade

As I mentioned, this one is tweaked!
This one is calculated with 3 variables…
Let me know what you think about it!

Regards,

Ceurami

3. astrotrade

hi,
how to plot arrows in this afl

4. morgen

“astrotrade”, try this:

_SECTION_BEGIN("TSI");
r = Param( "TSI period 'R':", 7, 1, 100, 1 );
s = Param( "TSI period 'S':", 27, 1, 100, 1 );
u = Param( "TSI period 'U':", 1, 1, 100, 1 );
sig = Param( "Signal period:", 7, 1, 100, 1 );
 
Mtm = C - Ref ( C, -1 );
AbsMtm = abs ( Mtm );
Num_T = EMA ( EMA( EMA ( Mtm, r ), s ), u );
Den_T = EMA ( EMA( EMA ( AbsMtm, r ), s ), u);

TSI = 100 * Nz ( Num_T / Den_T );
TSIL = 100 * Nz ( Num_T / Den_T );

//Green TSIL Line=Rising; Red TSIL Line=Falling
col = IIf( TSIL > Ref( TSIL, -1 ), colorGreen, colorRed );
Plot( TSIL, "TSI("+r+","+s+","+u+")", col, styleLine | styleThick);
//Green EMA TSI,sig Line=Rising; Red EMA TSI,sig Line=Falling
col = IIf( EMA(TSI,sig) > Ref( EMA(TSI,sig), -1 ), colorGreen, colorRed );
Plot( EMA(TSI,sig), "", col, styleThick);
Histcol= IIf(TSI>0,colorLime,colorRed) ;
Plot( TSI, "", histcol, ParamStyle("Histogram style", styleThick |
     styleHistogram | styleNoLabel, maskHistogram ) );
Plot(0,"",ParamColor( "ColorZero", colorBrown ),styleLine);

//Title = "TSI";
_SECTION_END();

mybuy=  TSIL > Ref( TSIL, -1 ) AND EMA(TSI,sig) > Ref( EMA(TSI,sig), -1 ) AND TSIL>EMA(TSI,sig) ;
mysell= TSIL < Ref( TSIL, -1 ) AND EMA(TSI,sig) < Ref( EMA(TSI,sig), -1 ) AND TSIL<EMA(TSI,sig) ;

Buy = ExRem(myBuy, mysell);
Sell = ExRem(mysell, myBuy);

PlotShapes(IIf(Buy,shapeUpArrow,shapeNone),colorBlue,0);
PlotShapes(IIf(Sell,shapeDownArrow,shapeNone),colorRed,0);
5. morgen

Try this:

mybuy=  TSIL > Ref( TSIL, -1 ) AND EMA(TSI,sig) > Ref( EMA(TSI,sig), -1 ) AND TSIL>EMA(TSI,sig) AND TSIL>0 ;
mysell= TSIL < Ref( TSIL, -1 ) AND EMA(TSI,sig) < Ref( EMA(TSI,sig), -1 ) AND TSIL<EMA(TSI,sig) ;

Buy = ExRem(myBuy, mysell);
Sell = ExRem(mysell, myBuy);

PlotShapes(IIf(Buy,shapeUpArrow,shapeNone),colorBlue,0);
PlotShapes(IIf(Sell,shapeDownArrow,shapeNone),colorRed,0);
6. niklravi

dear sir morgen

the formula aditions for buy and sell and plot arrows shows syntex error. can u pl check and post the entire formula ?

with regards
ravi
qatar

7. Devulsky

// Add this to TSI FORMULA code

mybuy= TSIL > Ref( TSIL, - 1 ) AND EMA(TSI,sig) > Ref( EMA(TSI,sig), -1 ) AND TSIL>EMA(TSI,sig) AND TSIL>0 ;
mysell= TSIL < Ref( TSIL, - 1 ) AND EMA(TSI,sig) < Ref( EMA(TSI,sig), -1 ) AND TSIL<EMA(TSI,sig);

Buy = ExRem(myBuy, mysell);
Sell = ExRem(mysell, myBuy);

PlotShapes(IIf(Buy,shapeUpArrow,shapeNone),colorBlue,0);
PlotShapes(IIf(Sell,shapeDownArrow,shapeNone),colorRed,0);
8. analystbank

Error is due to TSI Period R, S, U not defined, any solution where to initiatlise that

9. anandnst

WATCH COLOURED MACD …. Search it (Best one)

Leave Comment

Please login here to leave a comment.

Back