Entry Identification II for Amibroker (AFL)
rajaswamy over 15 years ago Amibroker (AFL)
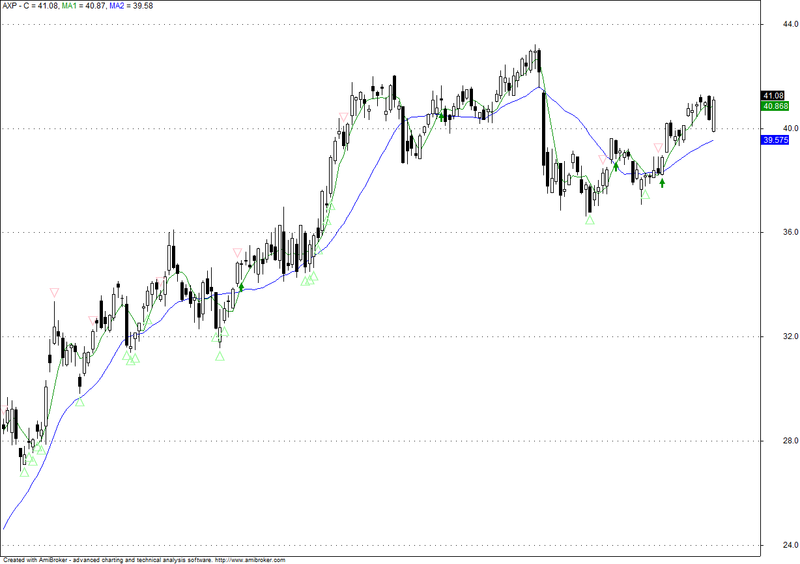
Second method of analyzing entries. Identify ideal entries, adjust indicators to find a good match
I GOT FROM
http://www.niftyclinic.blogspot.com/
Screenshots
Indicator / Formula
Copy & Paste Friendly
//	EntryIdentificationII.afl
//
//	Second method of analyzing entries.
//	Identify ideal entries, adjust indicators to
//	find a good match.
//
SetTradeDelays(0,0,0,0);
BuyPrice = C;
SellPrice = C;

//	This code looks into the future to compute
//	potential gain and potential loss from the present.
//	Gain is computed from Close of entry day
//	to Close of exit day.
//	Risk is computed from Close of entry day
//	to lowest Low while in trade.
DaysAhead = Param("DaysAhead",5,1,20,1);
GainAhead = 100.0 * (Ref(C,DaysAhead) - C) / C;
RiskAhead = 100.0 * (C - LLV(Ref(L,DaysAhead),DaysAhead)) / C;

DesiredProfit = Param("DesiredProfit",5,0.5,10,0.5);
MaximumRisk = Param("MaximumRisk",3,0.5,10,0.5);

IdealEntry = (GainAhead >= DesiredProfit)
					AND (RiskAhead <= MaximumRisk);

HoldDays = Param("HoldDays",3,1,60,1);

IdealExit = BarsSince(IdealEntry) >= HoldDays;

//	Remove extra exits, but show all entries.
IdealExit = ExRem(IdealExit, IdealEntry);

IdealShape = IdealEntry * shapeHollowUpTriangle
				+ IdealExit * shapeHollowDownTriangle;
IdealColor = IIf(IdealEntry,colorPaleGreen,colorPink);
IdealPosition = IIf(IdealEntry,Low,High);
PlotShapes(IdealShape,IdealColor,0,IdealPosition);

//	The ideal part is above -- the candidate indicator is below

//	Moving average crossover
MALength1 = Param("MALength1",5,1,50,1);
MALength2 = Param("MALength2",20,1,50,1);

MA1 = MA(C, MALength1);
MA2 = MA(C, MALength2);

IndicatorBuy = Cross(MA1, MA2);
IndicatorShape = IndicatorBuy * shapeUpArrow;
IndicatorColor = colorGreen;
IndicatorPosition = IIf(IndicatorBuy,Low,High);
PlotShapes(IndicatorShape,IndicatorColor,0,IndicatorPosition);

Plot(C, "C", colorBlack, styleCandle);
Plot(MA1, "MA1", colorGreen, styleLine);
Plot(MA2, "MA2", colorBlue, styleLine);
GraphXSpace = 5;
//Figure 7.16 Entry Identification II
0 comments
Leave Comment
Please login here to leave a comment.