Bressert DSS for Amibroker (AFL)
Anonymous over 15 years ago Amibroker (AFL)
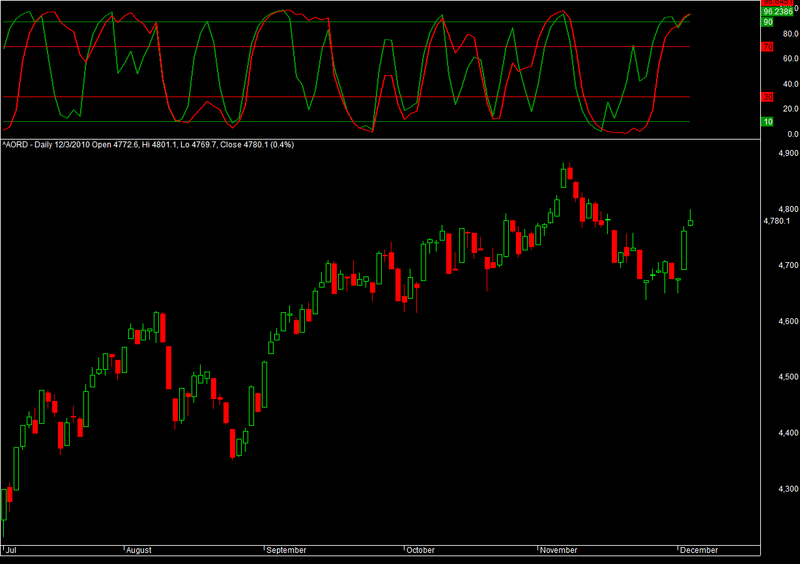
This is the Bressert’s DSS from MetaStock code
Its calculation algorithm is very similar to that of stochastic indicator. The value above 80 signifies the overbuying, the value below 20 signifies the overselling.
Screenshots
Indicator / Formula
Copy & Paste Friendly
_SECTION_BEGIN("DBS10");
SetChartOptions(0,0,chartGrid30|chartGrid70);
Slw = Param("Slowing double stoch",3,1,5,1);
Pds = Param("Periods double stoch",10,3,21,1);
A = EMA((Close-LLV(Low,Pds))/ (HHV(H,pds)-LLV(L,Pds)),Slw)*100;
ind = EMA((A-LLV(A,pds))/(HHV(A,Pds)-LLV(A,Pds)),Slw)*100;
Upper=Param("Upper", 70, 50, 100, 1);
Lower=Param("Lower", 30, 0, 50, 1);

Plot( ind, "ind", ParamColor( "Color", colorRed ), ParamStyle("Style", styleThick) );
Plot(Upper,"Upper",ParamColor( "ColorUpper", colorRed ),styleLine);
Plot(Lower,"Lower",ParamColor( "ColorLower", colorRed ),styleLine);
_SECTION_END();

_SECTION_BEGIN("DBS5");
SetChartOptions(0,0,chartGrid10|chartGrid90);
Slw = Param("Slowing double stoch",3,1,5,1);
Pds = Param("Periods double stoch",5,3,21,1);
A = EMA((Close-LLV(Low,Pds))/ (HHV(H,pds)-LLV(L,Pds)),Slw)*100;
ind = EMA((A-LLV(A,pds))/(HHV(A,Pds)-LLV(A,Pds)),Slw)*100;
Upper=Param("Upper", 90, 50, 100, 1);
Lower=Param("Lower", 10, 0, 50, 1);

Plot( ind, "ind", ParamColor( "Color", colorGreen ), ParamStyle("Style", styleThick) );
Plot(Upper,"Upper",ParamColor( "ColorUpper", colorGreen ),styleLine);
Plot(Lower,"Lower",ParamColor( "ColorLower", colorGreen ),styleLine);

Title =FullName();
_SECTION_END();
0 comments
Leave Comment
Please login here to leave a comment.