TD Retracement for Amibroker (AFL)
albertly over 15 years ago Amibroker (AFL)
Implementation of Tom Demark “The New Science Of Technal Analysis”
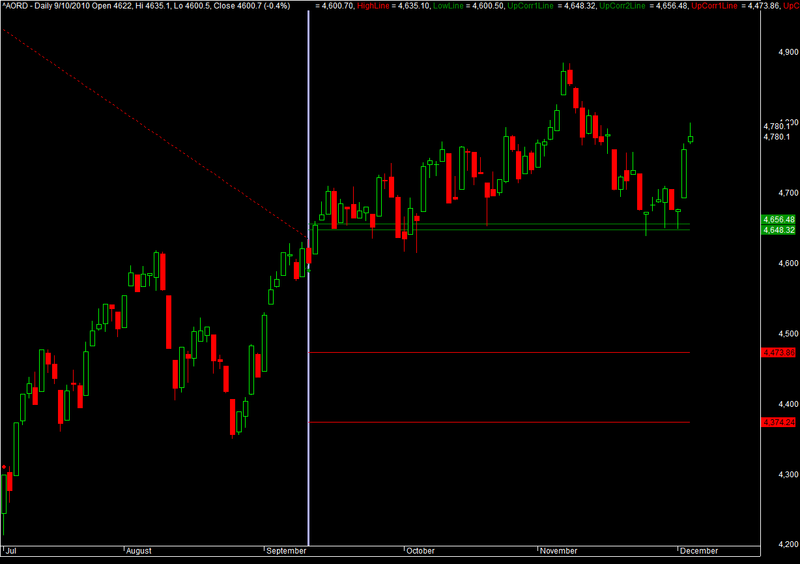
Screenshots
Indicator / Formula
Copy & Paste Friendly
_SECTION_BEGIN("TD Retracement");
/* Implementation of Tom Demark "The New Science Of Technal Analysis"

By Albert Lyubarsky

.382
.618
Magnet price (high/low day's close)
1.382
1.618
2.236
2.618
3.618


Click on High to see down retracement .382 and .618 - Red lines
Red dashed line and red SmallCircle shows how retracments are built.


Click on Low to see up retracement 1.382 and 1.618 - Green lines
Green dashed line and green SmallCircle shows how retracments are built.


There is no any sense to click on low and try to see down retracement (red lines).
There is no any sense to click on high and try to see up retracement (green lines).

 */


MinVal = 9999;
MaxVal = -9999;
PrevMinVal = 9999;
PrevMaxVal = -9999;
PrevMin = -1;
PrevMax = -1;
k= SelectedValue(BarIndex());

MaxVal = High[k];
MinVal = Low[k];
// Find first "low" that is lower than Low[k] - countdown
for (i = k-1; i >= 0; i--)
{
	if (MinVal > Low[i])
	{
		PrevMinVal = Low[i];
		PrevMin = i;
		break;
	}
}
// Find firstt "high" that is higher than High[k] - countdown
for (i = k-1; i >= 0; i--)
{
	if (MaxVal < High[i])
	{
		PrevMaxVal = High[i];
		PrevMax = i;
		break;
	}
}


// Find "lowest" between High[PrevMax] and High[k]
MinInMaxRange = 9999;
MinInMaxRangeIndex = -1;
for (i=PrevMax; i <= k; i++)
{
	if(Low[i] < MinInMaxRange)
	{
		MinInMaxRange = Low[i];
		MinInMaxRangeIndex  = i;
	}
}
// Find "highest" between Low[PrevMin] and Low[k]
MaxInMinRange = -9999;
MaxInMinRangeIndex = -1;
for (i=PrevMin; i <= k; i++)
{
	if(High[i] > MaxInMinRange)
	{
		MaxInMinRange = High[i];
		MaxInMinRangeIndex = i;
	}
}


// Fibonacci correction
DownCorr1 = MaxVal + (MinInMaxRange - MaxVal) * 0.382;
DownCorr2 = MaxVal + (MinInMaxRange - MaxVal) * 0.618;
UpCorr1 = MinVal + (MaxInMinRange - MinVal) * 1.382;
UpCorr2 = MinVal + (MaxInMinRange - MinVal) * 1.618;


DownCorr1Line = LineArray(k, DownCorr1,  EndValue( BarIndex()), DownCorr1,0 );
DownCorr2Line = LineArray(k, DownCorr2,  EndValue( BarIndex()), DownCorr2,0 );

UpCorr1Line = LineArray(k, UpCorr1,  EndValue( BarIndex()), UpCorr1, 0 );
UpCorr2Line = LineArray(k, UpCorr2,  EndValue( BarIndex()), UpCorr2, 0 );

HighLine = LineArray(PrevMax, PrevMaxVal, k, MaxVal, 0);
LowLine = LineArray(PrevMin, PrevMinVal, k, MinVal, 0);


Plot(Close,"Close", colorBlack, styleBar );
Plot( HighLine , "HighLine", colorRed,styleDashed | styleNoLabel  );
Plot( LowLine , "LowLine",colorGreen  ,styleDashed | styleNoLabel );

Plot( UpCorr1Line  , "UpCorr1Line ", colorGreen );
Plot( UpCorr2Line  , "UpCorr2Line ", colorGreen );

Plot( DownCorr1Line , "UpCorr1Line ", colorRed );
Plot( DownCorr2Line , "UpCorr2Line ", colorRed );

PlotShapes( IIf( BarIndex() ==  MaxInMinRangeIndex  , shapeSmallCircle , shapeNone ), colorGreen  );
PlotShapes( IIf( BarIndex() ==  MinInMaxRangeIndex , shapeSmallCircle + shapePositionAbove , shapeNone ), colorRed );


_SECTION_END();
3 comments
Leave Comment
Please login here to leave a comment.
SHOWS LN: 67, col:10 Error 10. subscript out of range. you must not access array outside 0…(BarCount-1) range.
Help correct the above…TX
Red dot is not getting displayed.I am able to see only green dot.
Can anyone explain as to how to interpret this indicator for buy and sell conditions.
Thanks in advance.
Thanks,
Gopal
This is to solve * SHOWS LN: 67, col:10 Error 10. subscript out of range. you must not access array outside 0…(BarCount-1) range. * issue
Replace line 30 ~ 39 with the following statement:
//— Modified by Kelvinhand, 2016/1/22
// can see the following URL:
// http://www.traderji.com/amibroker/100949-td-relative-retracement.html
//—
PrevMinVal = 9999;
PrevMaxVal = -9999;
k= SelectedValue(BarIndex());
MaxVal = High[k];
MinVal = Low[k];
PrevMin = k;
PrevMax = k;
//—- End of Modified by Kelvinhand